Monday, March 31, 2025

Lower Low - Swing Around Day - Higher Close

Today in the daily ES futures made a lower low, primarily overnight, touching the lower daily Bollinger Band, then turned around to close higher. The lower low below the 18-day SMA continued the swing-line extension lower, but, according to Ira's method, it is not in a trend as it has a previous higher high, and then the lower low. It is in what he terms a 'vertical price break'.


And while the front-month or June futures contract - and the SPY cash - made the lower lows compared to the March 13 low, the roll-over futures contract did not. This raises the suspicion that on the short term, a triangle or a Flat wave is being made. That being the case, it is possible for price to revisit the 200-day SMA, although that is not required. Price could just break down and make a further lower low which might then be a fifth wave of the decline.

Interestingly, on an up-close day, the daily slow stochastic lost its over-bought status and is now neutral. There were a couple of ways you could sniff out the possible up day: 1) the weekend stock-market videos were almost solidly bearish - a potential contrarian indicator, and 2) today is the last day of the month and usually sees the typical sloppiness of the window-dressing from portfolio managers with tomorrow as the first day of the new trading month which might see inflows from the usual sources (401k's, retirement accounts, dividend reinvestment plans, etc.). Very often, the futures front-run those inflows, and that may well be what occurred in the latter part of the day.

Of course, over the next couple of days, additional tariff news will be announced, as will the results of the President's third-term election results (..just kidding, I think).

Have a good start to the evening,

TraderJoe

Saturday, March 29, 2025

Could the Market Triangle? - A Long-Term Alternate

In prior posts (see LINK here) we have laid out the case for a potential expanding diagonal top, still in formation, or for a Primary  wave top at the recent high. Those counts remain active, as we do our best to count locally. But the Principle of Equivalence can be a little more insidious in some situations, and this often requires that we pay close attention while suspending our judgement for just a bit. One thing is not this uncertain. In terms of absolute points (not necessarily percentage in some situations), this down wave is currently longer than all the prior ones since October of 2022. So, it does appear that we may well have had a true turn-of-degree by the definitions involved.

Still, when we back out and look at the two-weekly ES chart in close-only format, we see that we are still in a parallel since March 2020, as below.

ES Futures - 2 Weekly - Close Only

So, because we haven't overlapped anything downward yet, and because the wave (2), down, is a simple zigzag, The Fourth Wave Conundrum - that occurs of every degree of trend, and The Principle of Alternation say that we could get a very sideways triangle or flat - which does not overlap - to make a fourth wave, (4). Note that with 131 candles on this chart, the EWO, while declining, has not come back down to near the zero line, yet.

It is possible a fourth wave triangle could coincide with a FED rate-cutting cycle during a recession if one should occur. This may have the effect of getting the animal-spirits flowing again and keeping the market afloat.

Caution: there is virtually nothing that is guaranteed about this scenario. The expanding diagonal could still happen. And, if the triangle does happen, as above, there can still be a lot of down-side movement yet even from here. We are not yet down to 38 - 50% of wave (3).

We include this scenario for completeness, and because the up waves (1) & (3) are just messy enough in their counting to possibly allow it. Further, we have not seen a clear, massive, agreed-upon triangle on the weekly chart, though the daily triangle possibility at this high has been noted by several analysts, me included. So, this is just a scenario to keep in the back of your mind, even though the expanding diagonal and the Primary wave may agree more with the extreme market over-valuation and extreme, extreme long-term bullishness.

Have an excellent rest of the weekend.

TraderJoe

Thursday, March 27, 2025

Lower Low, Lower Close (LLLC)

Today's lower open in the ES daily futures, combined with the lower close, allows the swing-line indicator to be continued lower today, as shown in the chart below.

ES Futures - Daily - LLLC

Despite the seemingly small size of bar, it was quite a whippy day and continued the trend of complex and confusing price action. In a way, the bar does represent the "battle at the 18-day SMA" with prices on both sides of it and a close near it. A possible tell is that prices closed in the lower half of the bar by the cash close (futures are still trading as this is being written). Further, the upper daily Bollinger Band is now under the 200-day SMA and should provide resistance to upward price movement. The daily slow stochastic at the cash close was still in over-bought territory.

That said, a break of either the last down (red) fractal or the prior up (green) fractal would help provide additional clarity. A break of price under that down (red) fractal - which is also below the 18-day SMA might set a sell signal for the algo's that use the band as a reference. This is not trading or investment advice - just describing what some algo programs might do.

From an EW perspective on the intraday chart, we counted three waves down, three waves up, and a close below the prior 'b' wave (see LINK here).

Have an excellent start to the evening,

TraderJoe

Wednesday, March 26, 2025

Back to 18-Day

On the ES daily chart, below, prices ran away from the over-bought condition we pointed out yesterday and they declined back to the safety of the 18-day SMA - as of the cash close - to decide what to do next. 

ES Futures - Daily - Back to 18-day SMA

This has the effect of temporarily at least turning the swing-line indicator lower. But the chart is dead neutral as price is at the 18-day SMA, although the daily slow stochastic is still in the over-bought zone. From an Elliott Wave perspective, the price action had the effect of overlapping the 'a' wave in the ES 4-hr channel, as below.


ES Futures - 4 Hr - Channel

So, now one must see whether the correction wishes to extend or not. In other words, is this just a 'x' wave down, or a 'i' wave down? It is again The Principle of Equivalence until the waves are long enough to enable a clearer count. However, if the channel broke lower, was back-tested and failed the back-test lower, then one would have more information to suggest that maybe the uptrend was over at the 50% retrace level. That is because 'usually' double-zigzags form a near-perfect channel, first, or a wedge, second. One negative sign is that price did not attack the upper channel line today. So keep that one in mind.

Have an excellent start to your evening,

TraderJoe

Tuesday, March 25, 2025

Continuation

On the ES daily futures, the early higher high allowed the swing-line to be continued up to today's bar as shown in the daily chart below.


And while this is in accord with the daily bias being higher, the daily slow stochastic tonight is entering over-bought territory. So, according to the methodology this should dissuade large amounts of new money from being committed here. Further, the upper daily Bollinger Band - after dropping down through the 100-day SMA (green crosses), risks crossing down under the 200-day SMA (the brown curve). So, in one way volatility is being sucked out of the market. 

For our part, we have noted lots of overlapping waves - some of them diagonals - and it may be emblematic of the reduction in volatility. Upward price travel is still in an upwardly sloping parallel which may indicate corrective waves. But even though price is having a rough time at the upper edge of the parallel, we have not yet concluded that upward price movement is over, or that the correction won't extend in another way. We watch for signs intraday - such as a triangle or larger diagonal.

One gap was filled to the upside today. Maybe another will fill. Maybe not. After the higher high, the news regarding the Conference Board Consumer Confidence (92.9% down from 100.1) came out and took some edge off of the upward progress. If people lose confidence and reduce spending, it will probably mean some tough going for the market unless government spending (Golden Dome, etc.) and other stimuli make up for it. So far, only marginal stimulus has been announced via the FED's reduction of the amount of QT noted in Chair Powell's press conference. And, yes, the tariff wild card still remains.

Have an excellent start to the evening,

TraderJoe

Monday, March 24, 2025

Daily Swing-Line & Bias Flip

Over the weekend, regardless of what you heard about tariffs, the President made demands to spend billions on a Golden Dome (see this LINK), and when the markets heard the words, "Billions more in government spending - and possibly space based" they went bonkers, gapped up, and kept on going into the close. From the chart, below, you can see price is closing over the 18-day SMA, and the daily swing-line has flipped to positive.


This suggests the odds of the continued down move have flipped temporarily in favor of the up move with the overhead resistance possibly shown by the brown 200-day SMA, the upper Bollinger Band and the 100-day SMA (the green crosses).

So, even though we were expecting upward movement since the Mar 13th low, it may have gotten out of the range of a fourth wave. It's unfortunate, but it places the wave-counter in the position of having to wait for a new lower low, or even a newer all-time higher high, before deciding on the best wave labels. 

Literally, and I mean this sincerely, one could try placing an  or a  at that low. And that is all well and good. But it is still of minimal help. In other words, supposing one is thinking a diagonal down is forming. OK. But will it be a contracting diagonal or an expanding diagonal? And is this upward retracement even over? Try to keep in mind, the algo's just got a typical buy-signal based on the Bollinger Band methodology.

Rather this is one of those times when one simply needs more waves, or more overlaps to try to gauge what is going on. Yes, the current up wave is in a channel. If it should break lower tomorrow, more power to it. But, if it doesn't?

So rather than propose multiple wave labels at this time, it is probably best to stand back for a bit and just observe whether the power continues to the upside or a break lower immediately occurs. There are other markets that seem to be counting a bit better at the moment (like Gold), and so maybe that is where some attention should go.

Have an excellent start to the evening,

TraderJoe

Sunday, March 23, 2025

Neely Style Chart

I have written before how the zigzag indicator, properly configured, can be used to emulate a Neely-style wave chart which can offer some clarifying information on the current wave situation. The ES 4-hr chart is shown below, again using this technique.


With 132 bars on the chart, the current count looks pretty straight-forward. First, there is no overlap of wave (iv) with wave (i) to be a cause for concern. Second, the Elliott Wave Oscillator (EWO or AO) is still within the range of a fourth wave, and the wave (iv) price, itself is still within the 38 - 50% retrace of wave (iii) that would be expected of a fourth wave. This is shown by the Fibonacci ruler on the middle-right. Third, there is alternation between the forms of wave (ii) and wave (iv) at present. This would still be the case if wave four decides to triangle - which is does not need to do. It is optional. Fourth, the third wave down, (iii), is greater than a 1.618 extension of wave (i) so we are supposed to err on the side of a third wave rather than a (c) wave. And fifth, the third wave, (iii), is in a channel with an impulse count visible. 

All of this is only to say that the probability of a downside continued move is slightly greater than that of the alternate three-wave-count shown in red below the price bars. But I'd still only rate the probabilities as about 65-35%, but 35% odds events are not prevented from occurring in any manner.

The beauty of the zigzag chart is that it connects the actual price vertices when used properly to show the real wave terminal points, but it still eliminates a lot of the noise while confirming some or most of the interior wave structures. Further, the actual price bars can be hidden as above to allow the study of the movement without other distractions.

As a completely sidenote one can also observe that some of the sentiment indicators are dead neutral. These include the advance/decline statistics, the McClellan Oscillator, overall bull-bear ratios (not just the AAII sentiment) etc. So, the chart provides what it does, and the alternate structure is clearly indicated.

Have an excellent rest of the evening and the weekend,

TraderJoe

Friday, March 21, 2025

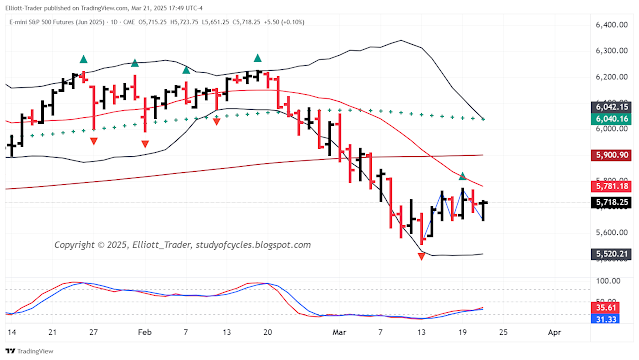
Lower Low, Higher Close (LLHC)

The ES daily futures made a lower low day, along with a lower high, but swung around at near the end of the session to make a higher close. The daily chart is below. P.S. I'm not sure how this chart will look when Monday reflects the settlement, as the settlement might show a lower close as of 4 PM ET.


In any event, the lower low and lower high were enough to extend the swing-line indicator to today's bar. Price still closed below the 18-day SMA, so the bias remains down, and the 18-day SMA is still declining. The daily slow stochastic has recovered from an over-sold condition with both the %K & %D lines closing over the 30 level.

Again, note the upper Bollinger Band has dropped to join the 100-day SMA (green crosses), and this might provide resistance levels for the next rise.

The wave count is very overlapping since the low of 13 Mar, and it might suggest either a triangle or a diagonal in form. More waves are needed, either as additional lower low days to continue the down trend, or higher high days to make a turn upward.

Have an excellent start to the evening and the weekend,

TraderJoe

Thursday, March 20, 2025

Lower High, Higher Low (LHHL)

The ES daily futures so far have had a lower high day, and a higher low day (the futures are still trading after the cash close). This has the effect of again changing the direction of the swing-line indicator lower, when it was previously higher as in the ES daily chart below. The local swing-line is shown on the chart below as the blue line between the bars.


Currently, all of these gyrations are taking place below a declining 18-day SMA. Yesterday's temporary up trend indication in the swing-line indicator is negated by the filter of taking place below the 18-day SMA. Still an overall lower low than 5,559.75 is likely needed to claim a clean five-waves-down.

We have counted the up wave since that low as w-x-y with a possible -of-y failure today that resulted in the lower high. If that is the case, it could indicate the weakness that might suggest that the minuet (v) wave of the minute  wave is getting underway.

Regular readers of this blog should also note that the upper daily Bollinger Band and the 100-day SMA (green crosses) might join together soon. If they do, it might provide the upward resistance to an upward wave when it gets underway and closes above the 18-day SMA.

Have an excellent start to the evening,
TraderJoe

Wednesday, March 19, 2025

Marginal New High

ES futures made a marginal new high today on the FOMC report out and press conference. The ES 4-hr chart is below.


Price is still in the vicinity of the 38.2% retrace. It might again pop higher tomorrow, but if it starts to get over 50% around 5,808 - 5,810, then it would put the fourth wave in more jeopardy, and we would then be left with only (a), (b), (c) down as per the Monday 17 March post shown earlier. The EWO is still within range of a fourth wave, also.

Have a good start to the evening,

TraderJoe

Tuesday, March 18, 2025

Cash in a Coma

If you look at the recent move up in the SPY cash index - because of the missing overnight waves - it is very difficult to count. Yet, the ES hourly chart (front month only) counts like a simple zigzag, formerly in a parallel, with downward overlap on the A wave already.


Yes, either a zigzag (iv) or a triangle (iv) will alternate well with the flat (ii) on the ES 4-hr chart, shown previously.

Still tomorrow is FED Day, and we will wait while they hold us hostage to their dots and their pronouncements. 

Have an excellent start to the evening,

TraderJoe

Monday, March 17, 2025

Rubber Meets the Road

My understanding of Elliott's second parallel technique is that once a fourth wave location in an impulse is identified, then a line is drawn from wave two to wave four and a parallel is placed on the end of wave three, as below in the ES 4-hr chart.


So far, the ES is back to the 38% retrace level or thereabouts. The EWO has turned green with about 108 candles on the chart, and it is still in the range of -40% of the maximum negative reading (i.e. two negatives make a positive reading).  And there is alternation with wave (ii)/(b) at this point. At minimum a lower low is needed for an impulse wave. And, often, a fifth wave, should it occur can equal wave (i) in price, with a secondary target of (v) = 0.618 x [net ( (i) through (iii) )].

Please keep in mind, if the Smart Money wants, this is the most likely location that they will try to bust the wave sequence from.

Have an excellent start to the evening,

TraderJoe
Sunday, March 16, 2025

Degrees in the Dow

The Dow's weekly count has been somewhat vexing - to the point where many people are ignoring it and only counting the S&P500 and the NDX. From a degree labeling perspective, we have offered many of these observations before. The count is actually reasonably simple, but it has some twists and turns of interest as per the weekly Dow (YM) futures chart, below.

Dow (YM) Futures - Weekly Close - Intermediate (B)

We have noted before that if the three-waves down is Intermediate (2) or Intermediate (A), then the next Minor retracement wave must - by degree definitions - be smaller than it. We can find no way to do this in the Dow except to call the initial move off the bottom as a single-zigzag W wave composed of , , . That makes the Minor X wave as smaller in price & time than the Intermediate (A) wave.

Similarly, within Minor wave Y, the measure of the  wave is smaller than the prior Minor W wave. Also, depending on exactly where the minute  wave of Y ended, it, too, can be counted as smaller than the prior Minor W wave, and it can still have the subsequent  wave overlap it. So, what we have shown is just a placeholder for the minute  wave just for charting clarity, but it could have ended at any of the prior humps that have the  wave overlapping, making it smaller than Minor W.

Further, there is alternation in this count in the form of a contracting diagonal wave of Minor W, and an expanding diagonal  wave of Minor Y. Also, parts of the Minor W wave are extensively long in time and overlapping while much of the Y wave is expansive in price, even though as yet some is overlapping.

It is the decided difficulty of this count that makes us think that it is likely the Intermediate (B) wave count. Included in these difficulties are all of the many, many overlaps in both sections of the waves. Further the (B) wave count is one that - at this time - allows the SPX and NDX to make longer waves up than the prior up wave to 2021/2, and the Dow only make a shorter wave.

Have an excellent rest of the weekend.
TraderJoe

Friday, March 14, 2025

Higher High Day

Prices on the ES daily chart made a higher high day today. This has the effect of temporarily turning the Swing Line indicator up. However, neither is there a trend established by such, nor is there a close over the 18-day SMA as in the chart below.

ES Futures - Daily - Higher High Bar

But also notice that today there is an 18-day cross 200-day to the downside as of the cash close (futures are still trading as of this writing). And further note, the regular calculation of the Daily Slow Stochastic indicator remains embedded.

So, the bias remains down until we see a capitulation and / or a reversal bar with subsequent follow through higher. We showed the local count on the hourly SPY cash index in the comments for the previous post at this LINK.

Have an excellent start to the evening and the weekend,

TraderJoe

Thursday, March 13, 2025

Three Items to Note

Below is the weekly chart of the S&P500 cash Index along with the wave count since the low.  The first item to note is that price is approaching the lower channel boundary as drawn best fitting the wave terminals available.


The second item to note is that the current down wave is longer-in-price than the prior ⓒ wave of the Minor B wave down. This may mean that a turn of degree is at hand.

The third item to note is the alternation between the expansive Minor A wave (which is an Expanding Diagonal), and the compression of the Minor C wave impulse. The represents good alternation in a corrective wave.

Locally, the count is a little muddy as we got a triangle yesterday - as suggested - which can be seen either as a fourth wave down, with the fifth to follow, or just the fourth wave of a third wave; with a fourth and fifth to follow. I have no particular preference at this point. Price is still below the 18-day SMA and the daily slow stochastic is still embedded. As Ira would say, "there is currently nothing bullish on the chart".

Have an excellent start to the evening,

TraderJoe

Wednesday, March 12, 2025

CPI Sputters

The benign CPI report spiked the ES futures in the pre-market, yet - by the time of the cash open - the SPX had made a new high, but the SPY did not. As for the futures, they did make a new daily higher high bar as below but look to be closing in the lower half/third.

ES Futures - Daily - Close Inside the Band & Embedded

Note that after two consecutive closes below the lower band (odds about 4 - 6%), price travelled to the inside of the lower band and stayed there for the day. This close will likely reset the number of consecutive closes lower (this is being written with cash closed but the futures still trading).

Because of some of the discrepancies we noted, we started a possible contracting triangle count and are looking to see if we get a proper fourth and fifth wave down in one of two different ways that were outlined in the comments for the prior post. The second of the two counts doesn't follow a wave formation guideline really well, and also has a potential degree violation in it. So, we prefer the version that starts with the contracting diagonal, but they both have wound up in the same place. Let's see how it goes over the next couple of days.

Have an excellent start to the evening,

TraderJoe

Tuesday, March 11, 2025

Short Pluto Video

The title means the video is 'short' in length - about 3 mins - and related to Pluto somehow; not to try to short Pluto stock or something 🥵. But since EWI issued it for free on YouTube, I thought I'd share it with all just to be sure you were aware of the information. There is a caveat below the video.


The caveat is that EWI has been showing this chart for many, many years without the sought-after turn. Still, it's hard to fudge the numbers involved, and likely there is some real truth in there. So, enjoy the video and keep an eye on things.

TJ

Sunday, March 9, 2025

Patience, Patience - 2

In the prior post I referred to further analysis this weekend. That work is below and what is shown are the three-touch trends lines on the NDX with all the available historical data. The crux of this count is that we know the SPX made its low in March 2009, but the NDX never made the lower low.  So, perhaps that wave is a truncated zigzag in the NDX. That's just a zigzag where the C wave ( in this case) never quite makes the lower low. But the truncation would be a harbinger of the strength of the significant up wave to follow. The six-monthly close-only log chart of the NDX shows this as follows.


So, the alternation in this case might be two-fold. First, there would be a truncated zigzag versus an expanded flat. Second, there might be the alternation of "long-, short to short-, long ". Note that the current  down looks a lot like the prior  down on a log scale. That is not proof positive, but it certainly is curious.

A second attribute of this count is that it might explain three current anomalies in the recent up wave. First is the fact that 1) the current up wave is extraordinarily difficult to count, 2) the Dow has not made a longer wave up yet. It could, it just hasn't yet, and 3) the Dow does seem to be vibrating around the 1.618 exterior retrace on the down wave. (See chart as this LINK).

None of these criteria are necessarily fatal for the Dow. Enough market experience has shown the Dow can wander on its own for a while if it wants. But, taken together, and in view of the possible form of the NDX it must cause one to raise an eyebrow. Recognition of this for months prior is why I am sincere when I say, "there is no amount of downside that will surprise me". This is true even as we patiently count to see what the local direction is.

This is the second post this weekend, and if you have not seen the first one yet, you might like to read it now. 

Have an excellent rest of the weekend,

TraderJoe


Saturday, March 8, 2025

Patience, Patience

Before further analysis this weekend, I wanted to post this chart of my own construction showing current three-touch trend lines on the three-monthly log-scale chart of the S&P500 cash index.

SPX Cash Index - Three Month Bars - Log Scale Trend Lines

And while I encourage you to review the monthly RSI below the chart, and its current divergences from price, it would be helpful to post a couple of cautionary notes. Let me lead out by saying that the wedge itself outlines a certain level of risk that one might want to pay attention to. The upper wedge line would have to have prices break up through it and cause the upper wedge line to go parallel to reduce the risk. This is plausible but certainly hasn't happened yet. And the lower wedge line could be in play.

But if the ES futures have made '5-down' and overlapped certain waves, cash has not overlapped the most important down wave yet - the Aug/Sep 2024 high. The roll-over ES futures contract has not yet, either. But the NASDAQ (NQ) futures have overlapped that same peak, and that must be paid attention to.

Further, the Dow Jones Industrial has not yet made a lower local low over their January 2025 low. And that is curious. It may be that there is rotation out of tech and into stocks perceived to be more stable. So, we said earlier that stocks might go over the high again with a reduced probability. That is still the case and may depend more on the index being tracked.

Clearly, the three-month wedge might indicate a fourth and fifth wave inside the wedge to complete the upward count. But it doesn't have to. We'll try to indicate why later in the weekend.

But for now, the task at hand is to understand if the downward diagonal is ending or leading as the SPX 2-hr chart below shows. We have provided some minute degree wave labels for the wave as  or  at the wave (v) low. These follow from The Principle of Equivalence as related to market probabilities.

SPX Cash Index - 2 Hr - Diagonal

The Principle of Equivalence tells us to mind our p's & q's unless & until a retrace occurs that does not go over the high. And the patience comes from the fact that it took fully three-weeks to make the down wave. It does not have to, but it could take three weeks or more to make a corrective wave upward. Any upward impulse might take less time.

This is the part of the wave principle some people do not like. But if one wants to see a first wave down, then one simply must accept the necessity of allowing the market to make a decent second wave up. I hope to have more insights in further posts before Monday.

Have an excellent rest of the weekend,

TraderJoe


Thursday, March 6, 2025

Five Down

As of today, it is possible to count five-down as a contracting diagonal on the ES 4-hr chart, as below.


This is currently a 3-3-3-3-3 diagonal. It would have been nicer to see a 5-3-5-3-5 diagonal as it might have eliminated one possibility.

As it is The Principle of Equivalence tells us we must be patient and wait to see if there is a retrace wave that does not go over the high before being more committing to a down label. The wave is either , or . Because of overlaps on some charts, we have listed the  wave potential last with the lowest odds. I'd rate the odds roughly about 40:40:20 based on the overlaps. That does not mean going over the high again is impossible. It just means it has lower odds.

Yesterday, we said the 18 cross 100 SMA on the daily chart could lead to a lower low today. It did.

Today broke the November low on the ES roll-over contract, and price closed below the 200-MA on the daily front-month contract. Price is at the lower daily Bollinger Band and so Ira's "elbow" warning applies.

Have an excellent rest of the evening,

TraderJoe

Wednesday, March 5, 2025

Now 18 Cross 100

Today in the ES futures was an inside range day. A lower low was not made, but a 90% wave down was. So, this has the effect of turning the local swing-line up temporarily, but as long as price is under the 18-day SMA, a new upward trend is not in effect, even given we recognize some price gains we made today. The daily chart is below.


Other items on the chart include a close of price above the 200-day SMA, the brown rising curve, and the fact that the 18-day SMA now has a cross under the 100-day SMA. Often, not always, that cross leads to an additional lower low. We shall see. We have not had such a cross in more than a year. The cross has only occurred on the lead month futures contract, and not the roll-over contract, yet.

So, price is still in a down trend until it isn't, and the daily slow stochastic (regular calculation) flirts with embedding and losing that status. So, the wave structure is a mixed bag at the moment on the daily, and we are counting locally in the comments and have provided some ideas on the nearby wave count.

Much more than that can't be expected. Is it possible to return over the high? Yes, it is possible, but the odds are dropping rapidly every day we stay under the 18-day SMA. By the discipline, we shouldn't begin an upward count until / unless price closes back over the "line in the sand".

Have an excellent rest of the evening,

TraderJoe


Tuesday, March 4, 2025

Too Far ?

According to The Eight-Fold-Path Method for Counting an Impulse, with 120 - 160 candles on the chart the guideline for a fourth wave in the Elliott Wave Oscillator (EWO or AO) is +10% to -40%. The daily ES chart, below, has 145 candles on it - well within the desired range. The Method is the Featured post on this blog, and the link for it is located under the Purpose and Ground Rules on the upper right-hand corner of the main blog page.

ES Futures - Daily - EWO -69%

The EWO on this chart is currently at -69%. So, even though there is no downward overlap in the continuous futures contract - like there is in the lead month only - as best we can tell the upward count is over. We drew this chart earlier in the day, noted that it had the right look for an impulse and wanted to check the EWO at the end of the day after the expected rebound. The EWO remains out of range. The fifth wave truncation count was shown earlier in several posts and comments.

Any further lower lows would more strongly suggest that Intermediate (3), up, is over, and Intermediate (4), down, has begun.

Have an excellent rest of the evening.

TraderJoe


Monday, March 3, 2025

Two Options

Nothing in the ES daily chart has yet invalidated or been proved. Today price headed down to touch the 200-day SMA on the front-month futures contract. This is shown by the brown rising curve below price. In earlier posts, we said it could. It did. We don't know anyone else that outlined that possibility. As shown by the dashed lines, there are no lower lows, yet, leaving the two options shown.


The triangle doesn't look particularly good, but it counts acceptably. So, we must still be patient and see whether the truncation count applies or not.  These are very close calls, and one would have to have an excellent set of market metrics (usually not available to retail) to tell the difference as of the close today. Essentially, the question amounts to whether or not price will take a strong bounce of the 200-day SMA. It's a reasonable expectation that it would, but it is not required.

Have an excellent start to the evening,

TraderJoe