The SPY cash 30-minute close-only chart is below. This is to concentrate on the form of the wave without a lot of the noise. It is possible that Friday's low is the low of wave iv with a Ⓒ wave as an ending contracting diagonal within wave iv. So, it's certainly plausible another high could be made.
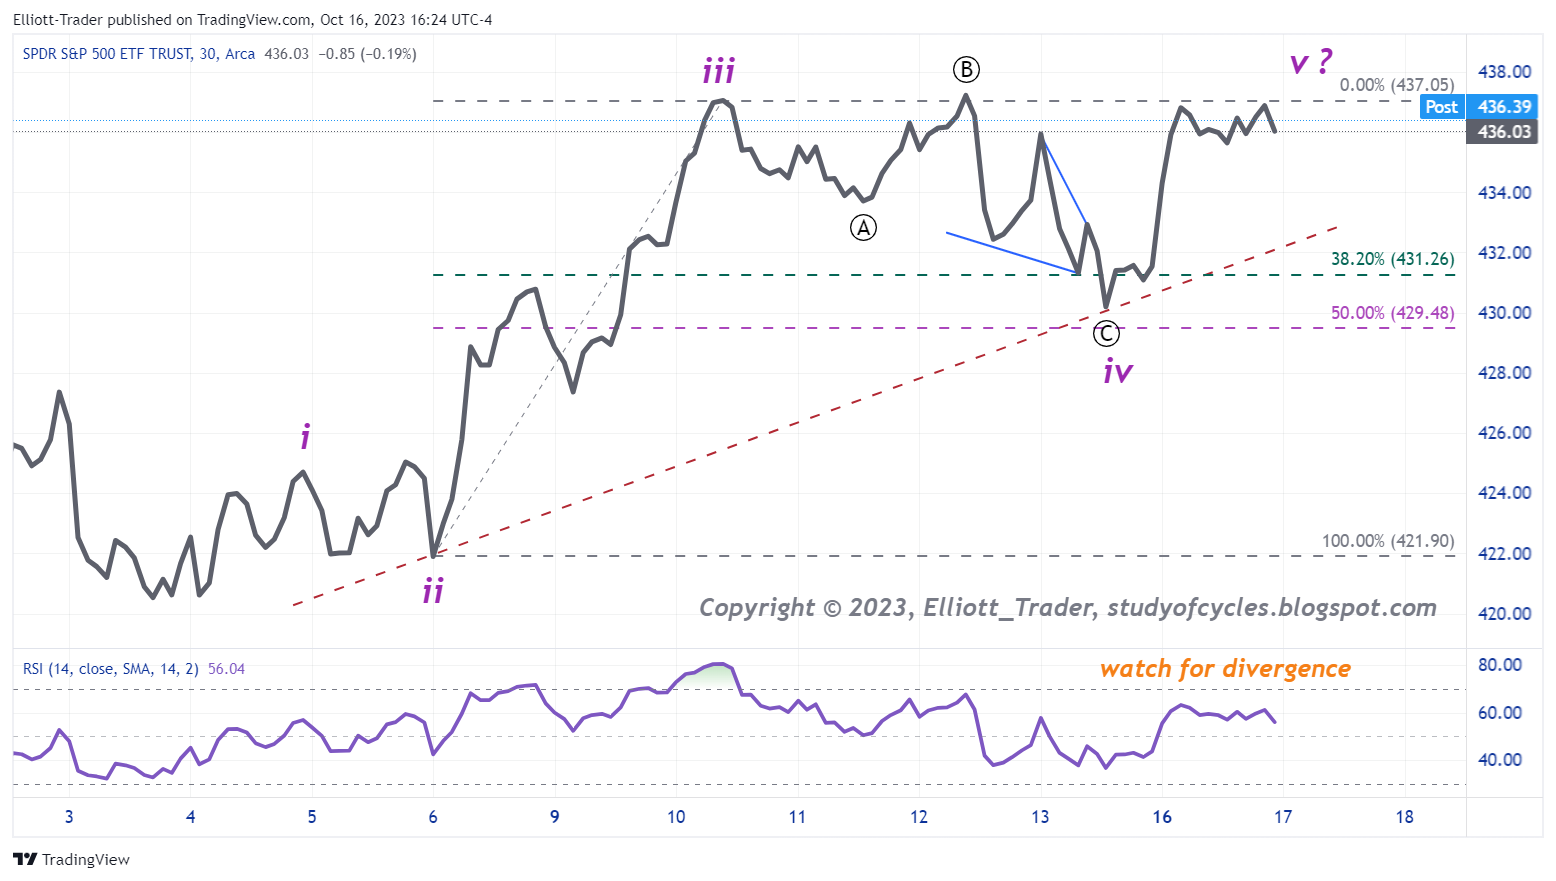
The fourth wave iv meets the typical parameters of 38 - 50% of wave iii although it is definitely a long and drawn-out affair. So, it certainly would be possible for prices to pop-up to the upper daily Bollinger Band or (significantly beyond that) the 100-day SMA to make a fifth wave. One should watch to see if that fifth wave provides an RSI divergence, as below. The daily slow stochastic is still only in over-bought territory and is not yet even trying to embed.
Then, after five-waves up there should be a reversal of some type, and the question will be how deep the reversal wave is, and whether the reversal is partial or a full retrace plus. Time will tell.
Have an excellent start to the evening.
TraderJoe
Should be red days galore now if we're going to do a repeat of 1929/87, with only a brief bounce at recent lows. There is a big gap at 4209, if/when that fails, we can crash. Window for a two day crash is six days before lunar eclipse to three days after.
ReplyDeleteThe next lunar eclipse is only partial and set for 10/28. The next full one is March 13/14 2025
DeletePartial or full, doesn't matter, still fits with the Puetz crash window criteria.
DeleteRut-Roh, Astro, bulls seem to be fumbling the ball here some. NQ futures already have a lower low. TJ.
ReplyDeleteSPY 30-min: has the higher high on a divergence.
ReplyDeletehttps://www.tradingview.com/x/hCC34EM5/
Might go further if it wants, because the question is whether the futures (ES 1-hr) will get a new high, also as an expanding ending diagonal.
https://www.tradingview.com/x/WYws0LPj/
TJ
Confusing as all hell. Both sides look right for a few hours.
ReplyDeleteOne full week trapped under 4400. Suggests to me that bulls are out of steam, sellers at this level. I'm hoping to see a Big Red Daily Candle tomorrow.
DeleteES 30-min: here is a reminder of the intraday 'wave-counting-screen' which can explain a lot - but not everything. Price has already come back down to the daily pivot (P).
ReplyDeletehttps://www.tradingview.com/x/GEysIxLm/
TJ
ES 30-min: touches 100-per SMA, and bounces a bit. From what I could see, price will eventually need to get up and over this half-hour bar to continue a diagonal upward. It might do so in the after-hours. TJ.
ReplyDelete..otherwise, if this morning's low is exceeded first, the diagonal might be a failure. That is allowed in a fifth wave because it's an ending wave. TJ.
DeleteES 30-min: the bar touch of the 100-per SMA is now a down (red) fractal.
Deletehttps://www.tradingview.com/x/4ysD0dje/
TJ
Gold update.
ReplyDeletehttps://imgur.com/H3Zrzty
ES 30-min: prior low has been exceeded lower, invalidating a further upward diagonal. Chart to follow when updates. TJ.
ReplyDeleteChart showing prior low exceeded:
Deletehttps://www.tradingview.com/x/iJZDHCS7/
TJ
Question for Gary Morgan and whomever wants to chime in regarding the crash post.
ReplyDeleteGary, how are you positioning for the crash you're expecting? Do you have a perspective on targets, timing (next couple weeks, or years) and characteristics? I'm only asking to understand and explore alternative point of views. I'm also bearish but I'm in the camp of a slow moving train wreck bear market that eats up victims as they try to roll over debt at higher interest rates over time.
For example, the latest bearish count as I understand it is an expanding diagonal in SPX. Do you expect the wave 'v' of 1 to be the crash? This would be much mor eminent. In contract, I'm viewing wave 1 to not be a crash, but it's a realization and pricing of the higher for longer reality. I expect wave 3 to be the slow moving train wreck in 2024-2026
Thanks
Dow (YM) daily - In the Dow (YM) futures roll-over contract, I'm not sure I'm fully ready to rule out that 1,2,i,ii nested count as I mentioned in an earlier comment.
Deletehttps://www.tradingview.com/x/WctiitRx/
There is a way to see i as about the same length as 1. And wave ii is shorter than 2 (..in the rollover contract). So, it is 'possible' the 1,2,i,ii will form. But, it is also possible to currently count 1,a,b,c,2,a,b,c, 3 of a larger expanding diagonal. The larger expanding diagonal has only the merest of edges at this time. Hope it helps.
TJ
Hello TJ. I just have some vix 35 strike calls that expire mid-November. Just a punt, and I'm not an expert, just aware of the Puetz criteria and see the similarities between 1929 and 1987 and today. Good luck.
DeleteThanks both, and appreciate the call out of the 1,2,i,ii probability.
DeleteHi GM .. re: the VIX. On a positive note, the VIX has made an 18-200 day Golden cross (See chart below). And price is up to the upper Daily Bollinger Band, but the daily slow stochastic is 'not' in over-bought territory.
Deletehttps://www.tradingview.com/x/33eOM2Zb/
For a valid breakout (again paraphrasing Ira) look for two consecutive closes over the upper band where price closes in the top 1/4 of the candle.
Best wishes,
TJ.
We appear to have two TJs, very confusing, heh. Good luck to all with your trades.
DeleteSPY 1-hr: this is the best I could see given the lower low in the ES 30-min invalidating the expanding diagonal. Perhaps it's a contracting diagonal (particularly in cash) as shown.
ReplyDeletehttps://www.tradingview.com/x/lZKtR6Ho/
The benefit of the count is it has a very clear invalidation level, also. Depends on if they have the mojo to get price near the high again. It does 'not' have to go over the top, but it certainly can.
TJ
Dow (YM) futures: possible to already see the ending count in the 4-Hr futures?
Deletehttps://www.tradingview.com/x/sFY3UNgx/
EMA-13 used as there are not 120 candles on the 4-hr chart. But there are still good divergences.
TJ
Dow Cash 15-min: looks like a first wave down. Up gap from 16 Oct now filled. Down wave is quite long in price relative to the others. Just be careful the most recent wave down isn't a "b" wave, and it swings back around to make a longer second wave in time.
ReplyDeletehttps://www.tradingview.com/x/2tsLqrBy/
TJ
P.S. depending on overlap or not there may be a way to consider it as a 'diagonal converted to an impulse'. There are enough down waves for that. TJ.
DeleteA new post is started for the next day.
ReplyDeleteTJ