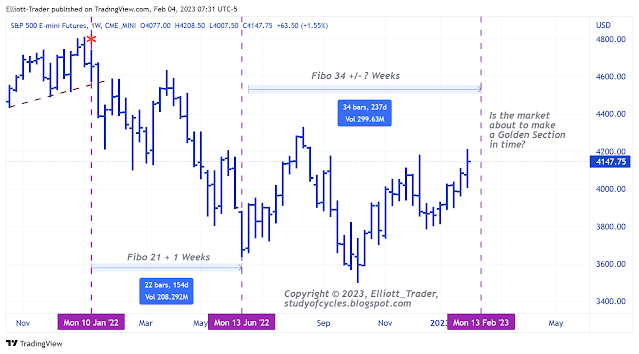
As a follow-on to the previous post, we noted that the down wave counted as Intermediate (1) currently consumed a Fibonacci 21 + 1 (or 22) weeks starting from the truncation bar. Not perfect, but very close. Now in the chart below, we examine what might be the length of time from that low.
 |
| ES Futures - Weekly - Golden Section ? |
When we do this study, we see the market is currently at the position of a Fibonacci 34 - 2 weeks (32) weeks in time. Can we allow that in the next two-to-four weeks we should know if the market wants to make a turn lower or not? If the market should trace out the Golden Section, it may indicate the timing is ripe for a decline, whereas if the Golden Section does not appear in this window, then that would suggest the timing is going out to 55 weeks, and that might put us near or over the high. Let's see how it goes.
On a different matter, this is one plausible count in weekly GOLD. A downturn may have started but we are not out of a daily channel just yet for the current wave.
 |
| GOLD (GC) Futures - Weekly - Expanded Flat ? |
Readers of this blog will note that price has approached the 78.6% Fibonacci retracement level, and that the Minor C wave is still inside of 2.618 x A when added to the Minor B wave of an Expanded Flat. These are the practical maximums for this count. On the daily price chart in Gold, this is possible.
 |
| GOLD (GC) Futures - Daily - Minor C in a Wedge? |
The current count would be a wedge-shaped Minor C. The only fly-in-the-ointment is whether a Flat is being made for a fourth wave minute ((iv)). But readers of this blog know to be on alert for the potential of an overlap and or channel break-and-backtest-with-failure which would tend to confirm the count is completed. Please note at the current time, I reserve the right to up the degree of these waves to Intermediate pending whether or not prices go over the high or do reverse here.
Have an excellent rest of the weekend.
TraderJoe
thanks TJ. 2 more weeks lines up with the next CPI report Feb 14
ReplyDeleteinteresting! TJ
DeleteThanks tj. So at present the golden section of 34 plus weeks around Feb 13 is almost neutral with a lower low? The Feb 14 inflation data is going to be lower as typically January is slow in consumption, which may give a tick to the upside.
Deletemanu you may be correct on CPI but what if it stays steady without a drop (and we never know how the market will react to data). imho, the market is already priced in inflation dropping like a rock. wage inflation, low unemployment and service inflation still an issue. going from 8 to 5% inflation the easy part. going from 5% to 2% could be really sticky. I personally don't see the fed cutting rates until something breaks either stocks or credit market.
DeleteAlso, the taylor rule is Fed funds rate needs to be 200 bps over the inflation rate to kill inflation. if inflation plateau out at 4 to 5% then fed rate needs to be 6 or 7% and that is not priced into the market. USA has 31 trillion in debt, we can not afford rates being in the 5 to 7% range for years as too much of the fed budget will go to paying interest only. In addition, historically in the stock market, after the FED cuts interest rates, stocks bottom 11 months after the 1st rate cut.
DeleteAgreed but not easy to bring es from 3500 to 4200 with so much underlying concerns including corporate results. Its a big retrace. Also Fed will have to live with 4% inflation target with the time as so much peinting done.
DeleteFED is responding to global de-dollarization and demise of the Petro-Dollar scheme. Inflation talk nothing but a red- herring imo.
DeleteAnother post is started for the next day.
ReplyDeleteTraderJoe