On the ES 4-Hr chart, below, here are the waves as we have actually counted them since the break of the wave (iv) trend line and possible truncation of wave (v). We haven't labeled the most recent down wave yet until we find out if it's a nested wave beginning or if Friday was just a small degree fourth wave Flat, as we suspect.

A key question will be whether the Support / Resistance line at 4,100 holds or not. If it doesn't hold, it is up to the bulls to prove they can get over the 4,200 level. With that idea in mind, here is the best alternate count we could imagine on the daily chart, and then how that translates over to the 4-Hr chart.

The above daily wave chart suggests it may be possible to construct a contracting diagonal on this time frame. But, so far, there are some things to be cautious of. First is that the diagonal did not make a full 62%+ downward wave for minute ((ii)). Second, the fourth wave, ((iv)), would not really have looked to touch the lower trend line yet, although this could change. And, as far as the Elliott Wave Oscillator, there is the expected divergence on ((iii)) versus ((i)), but a fourth wave has not yet shown a good signature close to the zero line. This could change, too.
So, here is a 4-Hr count that would agree with the above, but it has some problems that are discussed below the chart.
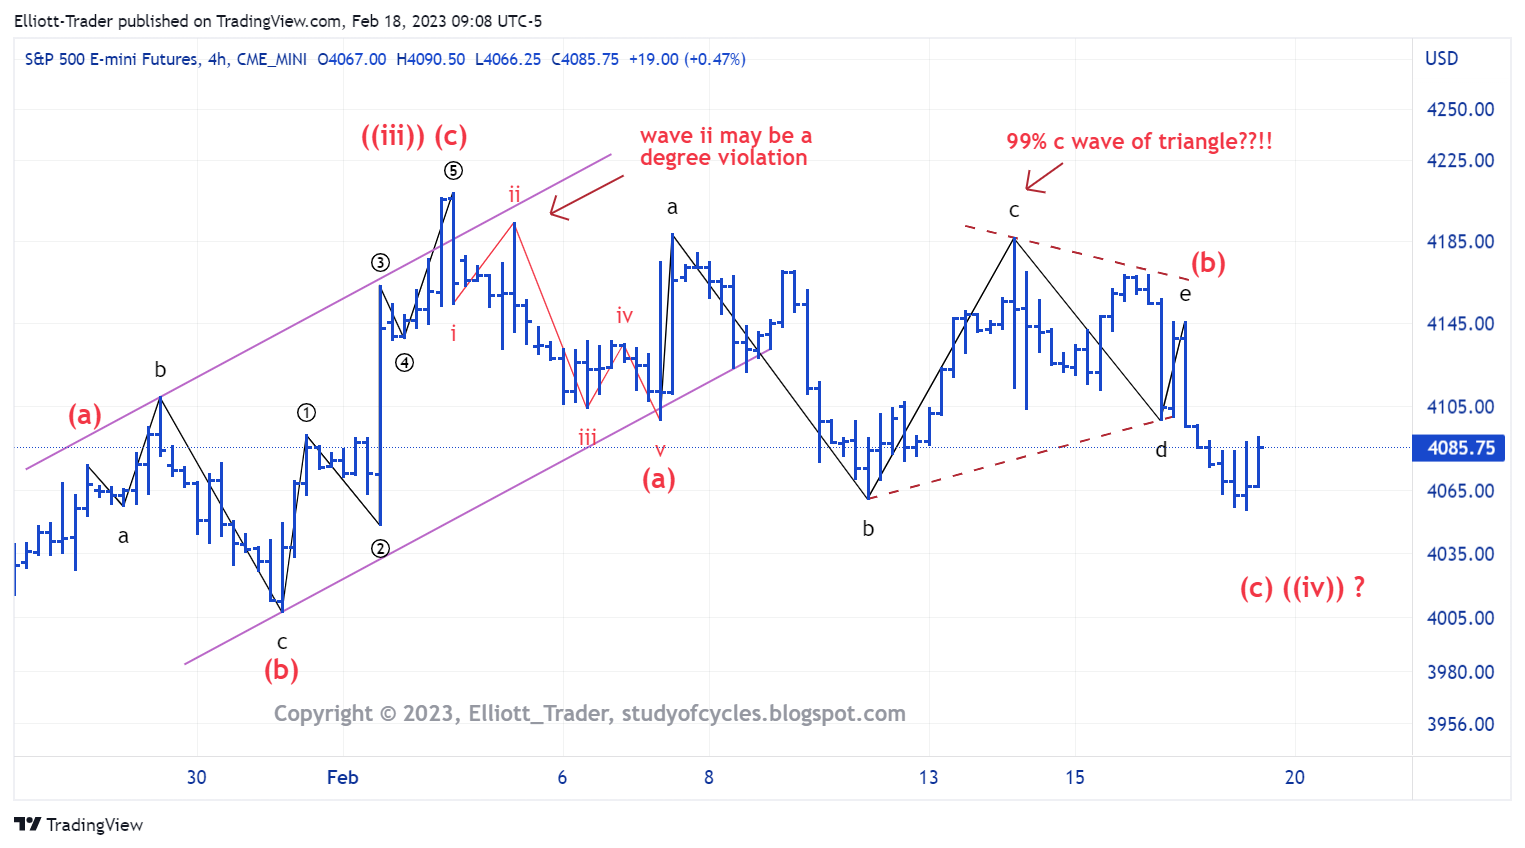
So, above, minute ((iii)) in the daily chart would be at the high, and minute ((iv)) would be under construction. But the problems are that if minuette (b) is a triangle, then the 'c' wave of the triangle is 99%+ the length of the 'a' wave of the triangle. That would be a very unusual relationship for a triangle. Further, within wave (a) down, wave ii is likely a degree violation because the ((B)) wave portion, the down portion, of ii would be 'longer-in-time' than its wave i counterpart.
So, all-in-all, the odds favor the current downward count. The onus is on the bulls to get price back up over 4,200. If they do, it would be 'mildly' surprising, but not too difficult to handle in the count. All we can do is count and analyze the waves. We don't make them. But we will be fair & balanced and try to provide both sides of the argument as we see it.
Sentiment is 'mid-range' here and is not of too much help. Yes, it is true that the Fear & Greed Index recently hit a significant high. But, sentiment surveys and put-call readings are mid-range. The VIX might indicate a kick-off but needs to make a higher daily high. So, one must remain flexible, calm and patient.
This is the type of work that is involved in real-life wave counting and it is likely few people undertake it in this detail.
Have an excellent rest of the weekend.
TraderJoe
Very informative post TJ, thank you!
ReplyDeleteYesterday you addressed a question posed by BBRider regarding the big picture count from 2009 and you referenced a post from January 2nd, 2022. This post suggested two potential outcomes for the SPX, one preferred and one pessimistic alternative. Incredibly prescient considering the market topped the following week. Do you have any preference between the two?
Welcome.
DeleteIF the Primary ((B)) wave was 'made by the FED', as is posited, then one might assume they get 'activist' again at some point in the future, loosen policy once again, and the market makes new highs down the road. The question is whether inflation eventually abates and allows such. Is the wave structure 'entirely' independent of the FED as EWI has often suggested? Well, let's just say my experience has not played out that way. TJ.
For reader reference, here is that post:
Deletehttps://studyofcycles.blogspot.com/2022/01/year-end-review-of-s.html
TJ
Hardly a matter of just experience imo. One simply has to overlay the inception and subsequent announcements of Q.E. with a multi-year chart of SPX and even a blind person can see it. Market price action supposed independence from central bank behaviour is the most irrational claim I have ever heard from Prechter. I understand his problem as this poses a problem for a fundamental tenet of EWT.
DeleteI'm not arguing the point overall - just that I think 1) timing, 2) amount, and 3) duration are factors. You remember the history, right. QE1 announced on Nov 25th, 2008.
Deletehttps://www.tradingview.com/x/xxz8IR3p/
The market until March 2009 was 'trading' on something else. Overall, though money moved the market, and the FED's money in subsequent years made stock market conditions very 'easy'.
TJ
This was a key factor in the market turnaround in 2009 and as far as I know, has never been reversed. https://www.latimes.com/archives/la-xpm-2009-apr-03-fi-fasb3-story.html
Delete@JC .. right you are. I remember that well. And as far as I know it has not been reversed yet, too. TJ.
DeleteJoe: why is your red up-arrow about the QE1 announcement in November, 2007, not 2008?
DeleteDespite CBs muddying the waters, paying attention to fib relationships I think can be helpful in identifying the likely correct EW count. For example, S&P 500’s top for its corrective rally from the October 12th, 2022 closing low (3,577.03) is (so far!) on February 2nd, 2023, at 4,179.76 (closing high). If that top not exceeded, then the rally from October 12th, 2022 through February 2nd, 2023 (77 trading days), would be approximately a Fibonacci 38.2% (1.00 - .618) of the time the Bear Market’s initial decline took from the alltime closing high of 4,796.56 on January 3rd, 2022 through October 12th, 2022, which was 195 Trading Days. The math: 75 (+ 2) trading days versus 195 trading days (75 / 195 = .382). Perhaps one can still find some semblance of order 8n a seemingly chaotic market if one tries. There are a few others that may be note-worthy.I think T.J alluded to one of them earlier.
Delete@Kelly O. Long-time readers of this blog know every once in a while, I 'throw one in there" to see if anyone is even paying attention. Congratulations, you passed the quiz. The actual situation as shown in the next link with FED Funds overlaid, shows the continual reduction in rates which accompanied the stock market decline.
Deletehttps://www.tradingview.com/x/qidKEf92/
When the lower bound was reached (0 - 0.25%), the FED had to come up with more tools.
TJ
A new post is started for the next day.
ReplyDeleteTJ