Let's get right to it. Let's have a look at the NASDAQ 100 (NDX) Index from a degree labeling perspective. The NDX is a much younger index than the Dow Jones Industrial Average, and it is composed of very much a different set of stocks. Therefore, you should get your head in the mind-set that it simply will count slightly differently than other indexes.
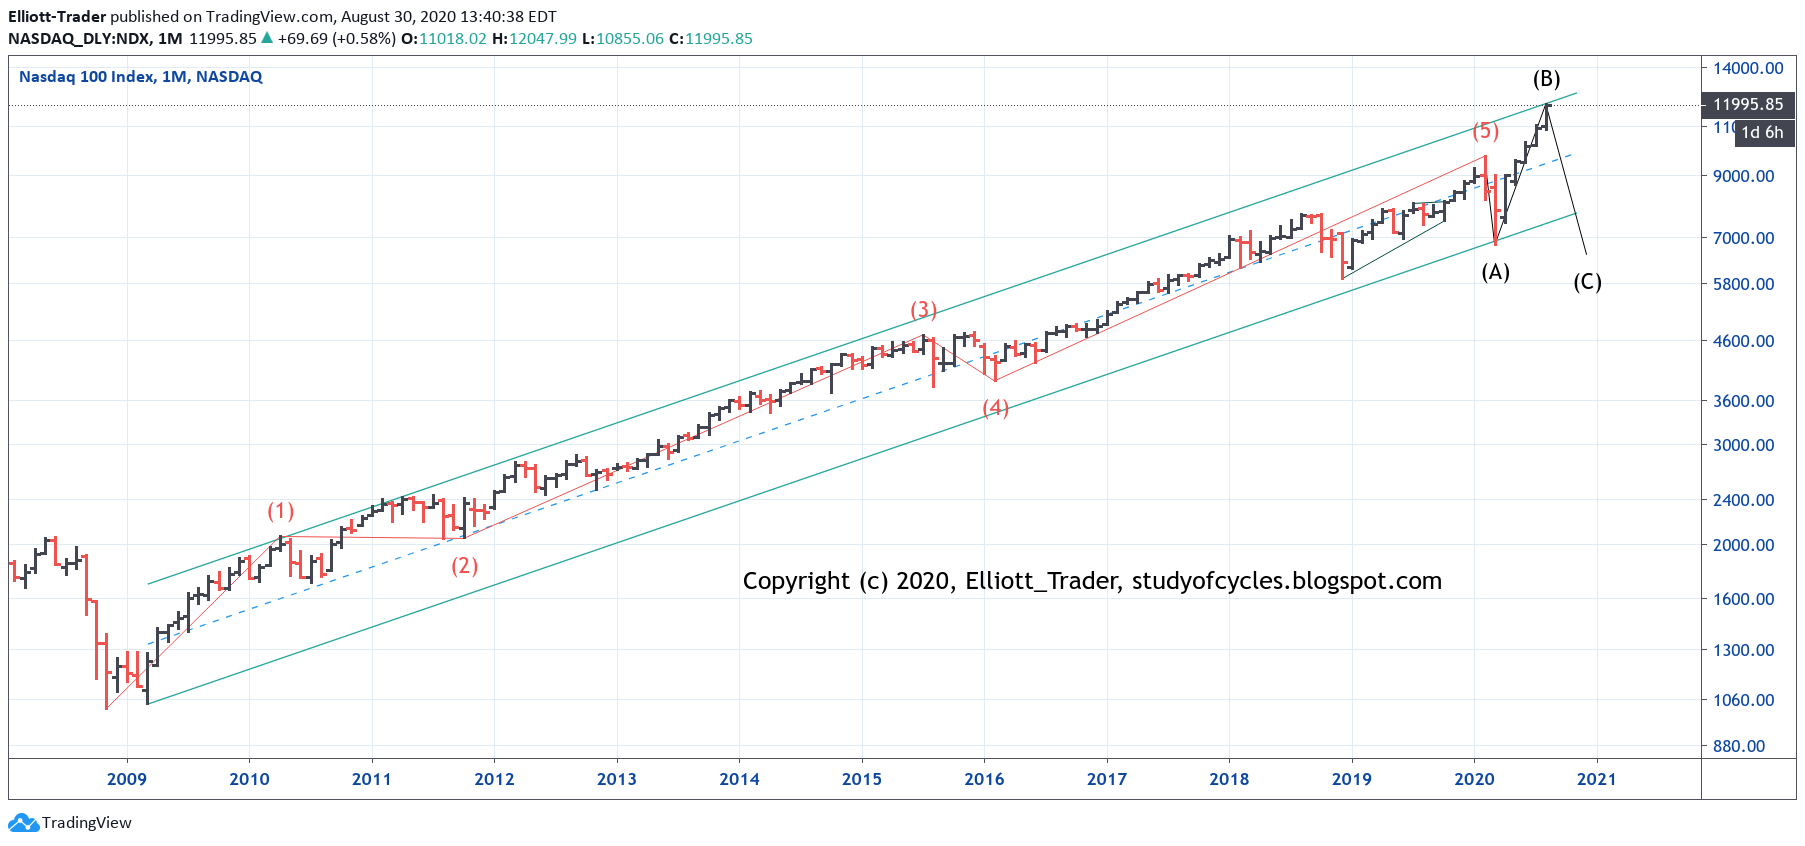 |
| NDX Index - Monthly - Intermediate (B) |
This first chart shows the most plausible count I can develop on this index that syncs with the Dow and the S&P500, even given the differences it will show. Where I believe the S&P500 has made a Primary ((A)) wave down, the NDX, being younger, has only made an Intermediate (A) wave down, and is now in the Intermediate (B) wave up. Let's go through the rationale on the weekly chart using FIbonacci levels.

Starting on the left-hand-side of the chart, we see the up wave from December 2019 to February 2020 exceeded the 1.618 external retracement on the minute wave ((w)), downward. Everyone wondered how this could happen if it was part of a flat wave. It wasn't. It was finishing its impulse up with a complex wave, including a triangle in the middle. In the NDX only (not the S&P500 as far as I can tell), it made the Minor 5th wave up, of Intermediate (5). Then, we see in this index, that the down move failed to make a new low, indicating strength. Other indexes as you may know made new lows. However, the down move counts like only a three-wave sequence in this index, instead of the five-wave downward ending diagonal in the S&P500. (For the long term count in the S&P500 Index, see this June 6th post, Trillions).
The recent up move from the March low has also exceeded the 1.618 external retrace on the down wave into 23 March 2020, shown for this index as Intermediate (A). This usually only happens in the (B) waves of triangles or in impulses, upward. Either way, the size of the move suggests the downward wave would again fail to make a new low in this index (other indexes might make a new low).
When a wave exceeds 1.618, it is suggested to look for a "running triangle" in a bull market. They are quite common, but we may not have seen one at this degree of trend, yet. This up wave has currently attained almost precisely 1.382 x the up wave from waves ((w)) -> 5. This is sometimes a level from which failed breakouts occur. So, if this is one Fibonacci level to take heed of, the next one comes from degree analysis of the daily NDX chart.
 |
| NDX - Daily - Nearing Equality |
This chart shows, if counted correctly, the up move in the NDX is very, very near C = A. This count would synch with the ES Futures count in the prior post of "Simplify, Simplify", and is something to watch closely. In the SP500 this would be part of a Primary ((B)) wave upward. In the NDX, it would be Intermediate (B).
Without a count like this it is hard to justify the extremely small pull-backs in the indexes. In this daily chart, the Minor B wave is even smaller than 23.6% in net retrace. But, beyond that, wave iv of C is one of the largest corrections in terms of time and price consumption. The only reasons to allow it in this degree count are that it consumes less total time than Minor B, and it consumes less price than the total wave travel within wave Minor B. In other words, the minute b wave up in Minor B consumes more price than wave iv does, so that might be acceptable. If not, it is very difficult to ponder how that wave is so large.
Next, notice the Relative Strength Index (RSI) on roughly two equal peaks. Interesting! Further, we are now very near two explainable Fibonacci levels C = A, and (B) = 1.382 x 5. It would be interesting if a turn resulted in the next day or two.
You won't see this chart analysis anywhere else that I know of. In any case, the large triangle portion and how the waves fit together was wholly and independently derived by me. This is the second post this weekend, and, if you have not seen it, you might like to see Friday's post in addition.
This additional chart and commentary was added after the overnight open of the futures, with a gap up.
 |
| ES Futures - 15 Minutes - Potential Diagonal |
Remember that the (C) wave of ((1)) was 'almost entirely' an overnight wave, and we now see a gap up to a marginal higher high which has nothing to do with the cash market. These gaps in the futures are 'often' (not always) filled more quickly than the ones in cash. The potential diagonal structure gives very clean invalidation levels and that's why it is sketched out. Wave ((3)) should not become longer in price - and hopefully not time either - than wave ((1)). If a wave ((4)) occurs, it may not become longer in price than wave ((2)) or trade below the end of wave ((2)). It would be great if it was shorter in time than wave ((2)), also. Wave ((4)) should overlap wave ((1)), and it would be great if it was either a 50% or 62% wave since wave ((2)) was a 62% wave.
The trend lines are tentative, particularly in the case of the alternate, below. And yes, if the diagonal is at the end of a Minor C wave, it's fifth wave can fail.
The alternate for this count is that wave iv ended as a triangle - similar to the cash market at the 3,486 level on Friday. The reason it is the alternate is I want to give the market all the time it wants to trade on Monday / Tuesday.
Finally, the NQ 100 Futures 4-Hr chart on the open. Now approaching double 1.618 extensions. It is probably an extended fifth wave.
 |
| NQ Futures - 4 Hr - Double 1.618 Extensions |
Have a good rest of the weekend.
TraderJoe
In your previous post where you have A then running flat and then c. Instead of running flat if we label as running triangle then we can count straight 5 waves for C after the triangle and abt to end by tomorrow probably...
ReplyDelete..as far as I know, a running triangle would still need to overlap it's wave A. And this one would not, as far as I can tell. Maybe in the futures? So, that proposal seems less likely, and I am showing five waves up for C, nearly complete.
DeleteI saw something similar to your B structure on the RSP a few weeks ago, and posted at the time. The RSP version is larger, but incorporates the June run up as your NDX does. Had the required overlap of A. I saw a WXY vs your abc, but to a similar result. Thanks for your post showing that.
ReplyDeletehttps://imgur.com/qk46GBj
No issues there.
DeleteAn additional chart and commentary we added after the Sunday night session opened.
ReplyDeleteTJ
Another excellent post Joe- I know we only count waves etc, But just wondering what would cause such a massive drop in NDX?
DeleteThank Fibo .. rotation to other sectors, interest rates rising, a retrace or new high eventually in the Dollar (makes it tough on multi-nationals), the prospect of a minimum Corporate tax (Biden), repatriation of tax dollars to pay for stimulus (either).
DeleteYep. Everyone is dollar bearish, and not considering the upward pressure on interests due to destruction of dollar-deominated debt as bonds default. It has always been a hidden and ignored structural risk and the Achilles heel of the FED. Despite their jaw-boning, they ultimately FOLLOW market rates,not set them, as most folk presume!
DeleteIn first chart
ReplyDelete0_2 TL violation
Why ignore it?
It has no such violation on arithmetic scale as one might use at the time to regularly count waves.
Deletehttps://www.tradingview.com/x/iWH8jAYb/
But beyond that, Neely does not address two factors an analyst is interested in. 1) Does the 0 - 2 trend line consideration hold when one switches from arithmetic to log charts? Although he says he regularly uses log charts, I have not seen that specific topic addressed, so I am not going to make things up. 2) He does not provide an "error bar" for that trend line consideration. In other words, does it work only on his particular style of charting - with two points each day (high and low plotted in the order in which they occurred)? Since he expressly 'does not use' OHLC chart, then what if a tail is below the 0 - 2, but the close is above at the high of the day. Would that be considered a 0 - 2 violation? And even in his charting method, does he allow a 0.5% error? He does not provide any statistically valid way to judge.
It's very simple. But it's very detailed. I won't make stuff up, and it is very difficult - and perhaps not effective - to chart as he does.
TJ
So
DeleteIt's a guideline going forward on this blog and reference to it as a rule should be avoided? I think a lot of impulses have formed but not been counted last several years at many different degrees because of this rule/guideline. I'd be interested in any rules you think are valid in addition to initial rules published by elliot
Neely never said it was a 'rule'. I think it should be utilized in the appropriate context. Just because there is a deviation on a log chart doesn't mean it didn't work on an arithmetic chart at the time of the observation. I noticed the same thing on the Dow long ago and wrote about it in the blog. Time is a factor. How many wave 2's are 'logs' away from their wave 1's? Do you see that point? In other words, the second wave often forms perfectly well on the arithmetic time frame.
DeleteA last chart was added of the 4-Hr NQ futures, also after the Sunday night open.
ReplyDeleteTJ
Neely sees massive expanding triangle. It will be really interesting in the next years.... not that now is boring:))))
ReplyDeleteA close up look as we turned overnight. Observations
ReplyDeletehttps://imgur.com/emDdJcp
The 15min gives a "cleaner" look. Histogram divergence followed by RSI divergence (at the Macd cross).
DeleteES 30-min, overlap and gap close has occurred as of 08:30 EDT.
ReplyDeleteTJ
The NQ just hit 1.618 and is backing off. The ES futures turned lower and invalidated the fourth wave of a diagonal. That leaves a possible triangle top.
ReplyDeleteThis triangle could have preceded the high, and be similar to cash.
Deletehttps://invst.ly/rzpt7
TJ
Some observations on AAPL (weekly).
ReplyDeletehttps://imgur.com/CBAMHKu
This comment has been removed by the author.
DeleteSeeing poss 5 waves down from overnight peak. 3rd wave 1.618 of 1st. 5th wave .618 of waves 1-3. RSI divergence on 5th, with Macd cross.
ReplyDeleteComments welcome.
Ed in cash?
ReplyDeleteThere is a new post started for the next day.
ReplyDelete