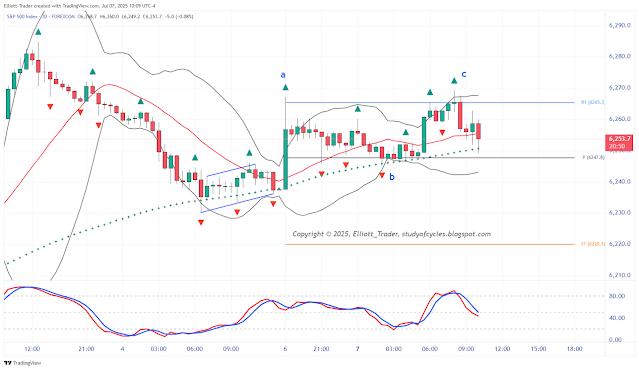
So far, the overnight action has an a-b-c, up, as in the ES/SPY (CFD) 30-min chart below. The intraday slow stochastic is meandering around the 50% level.
 |
| ES/SPY (CFD) - 30 min - a,b,c up |
The a wave up is an expanding leading diagonal, and the c wave is an impulse for good alternation in a corrective wave that has a marginal higher high. Three waves unfortunately does not provide that much information yet except that it looks corrective at this point.
Please be sure to translate this to the instruments you are following. Have an excellent rest of the day and start to the week.
TraderJoe
ES/SPY(CFD) 5 - min: at least a diagonal downward to 100% of ③; might turn into more. Watch that 100% level, and the high.
ReplyDeletehttps://www.tradingview.com/x/y0MSi4nN/
TJ
..now down through 100%. Either b wave of flat or next impulse. TJ.
DeleteES/SPY (CFD) 30-min: closes opening gap up.
Deletehttps://www.tradingview.com/x/CskXl15u/
Native ES 30-min did too.
TJ
ES/SPY (CFD) 30-min: another close below the lower band. Slow stochastic is over-sold.
ReplyDeletehttps://www.tradingview.com/x/2HwZ6bbx/
TJ
..and down to S2 daily pivot. TJ.
DeleteNow upward overlap on all downward waves .. which suggests the following count.
Deletehttps://www.tradingview.com/x/10KKWzzI/
TJ
ES/SPY (CFD) 30-min: into the cash close the swing-line is up but price is still under the intraday 18-period so the two fight each other at this time.
ReplyDeletehttps://www.tradingview.com/x/V1vTDwUn/
TJ
The bounce off yesterday lows for SPY appears to be in three waves - possible 'a' wave - with churn since today high possible 'b' wave. If so one rally leg in 'c' to complete upside correction and slide resume.
ReplyDeleteSPY (Cash) 5-min: this is all I have at the moment. Watch out for invalidation below 620 as shown.
ReplyDeletehttps://www.tradingview.com/x/UWRj6iSj/
TJ
Invalidation now: counts as "all-threes" as W-X-Y. TJ.
DeleteES Daily - as of the cash close there is just an inside bar as shown on the chart below (futures will still trade for an hour yet, but that's the settle).
ReplyDeletehttps://www.tradingview.com/x/iHOkCYDX/
The swing-line most recently had a higher high and higher low over the 18-day SMA as shown. Today's bar temporarily turns the swing-line higher. A lower low is needed to set a trend, but keep in mind price is still over the 18-SMA until it isn't and the slow stochastic is still embedded until it isn't.
TJ
NVDA Monthly Chart Count Proposal: https://ibb.co/TMtsXnb5
ReplyDeleteSo, arithmetic weekly close-only analysis gives a different result, because a) the channel is filled, b) there is a 38% retrace, and c) the top of wave ① is at a different location than yours, d) ③ = 4.236 x ①, which is a more common Fibonacci relationship, and e) the count has alternation in it.
Deletehttps://www.tradingview.com/x/IoLMbhFm/
So, if there is a large retrace, it could be a higher degree second wave.
TJ
"The end is nigh"
DeleteA new post is started for the next day.
ReplyDeleteTJ