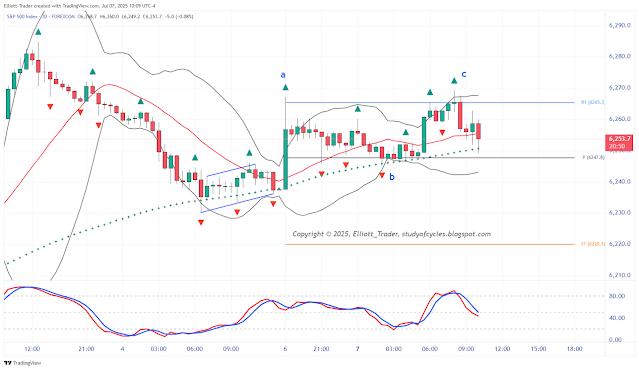
We promised in our last video that if additional waves higher were made this week, it would require a reconfiguration of the Minor A wave higher. Here is that reconfiguration, Essentially, we dropped the degree of the contracting leading diagonal one degree to minuet degree, symbol (i), composed of the five sub-minuette degree waves, symbols i-to-v. Then minute ⓘ is composed of the five minuet degree waves symbols (i)-to-(v). This count has the additional benefit that minuet (b) is shorter in price and time than minute ⓘ, the previous higher degree wave in the same direction, preserving degree labeling definitions.
 |
| ES Futures - Daily - Minor A Reconfiguration |
In this configuration, Minute wave ⓥ and Minor A now has a new limit shown on the chart of 6,633 because again the third wave in the futures is shorter than the first wave.
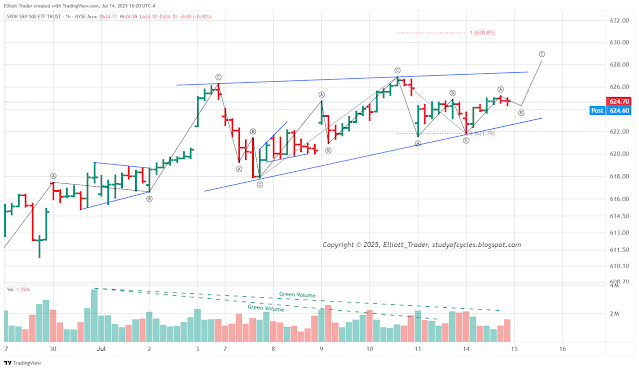
Critical note: since minute ⓘ is now an impulse, and the leading diagonal is only a minuet degree sub-wave, it is possible for this minute ⓥ wave to be an ending diagonal because it is at a different degree. So, it can either be an impulse or an ending diagonal wave. So, first we will show the current SPY 1 Hr chart in the impulse configuration as another extended first wave, at minuet degree,
 |
| SPY Cash - Hourly - Minute ⓥ Impulse Configuration |
We are showing this configuration as the extended wave (i), symbol x(i), because minuet (ii) is only a 38% retrace on the first up wave as shown by the Fibonacci ruler on the right. As you know by now, this is highly characteristic of extended first waves. We note that for the SPY, the lower wedge trend line has not even been broken yet!
As an alternate, we can drop the degree one level for the diagonal configuration as below.
 |
| SPY Cash - Hourly - Minute ⓥ Alternate Diagonal Configuration |
If a diagonal does form, then we would expect a 50 - 78% retracement of the entire up wave for minuet (ii). In that case, the attack on the lower trend line would fail rather dramatically. Although the preferred case is the impulse, because it is simpler, the diagonal alternate is noted for completeness and as another way to extend the Minor A wave in time as the diagonal would have to extend and further cycle through waves (i)-to-(v) yet again.
Have an excellent rest of the weekend,
TraderJoe


