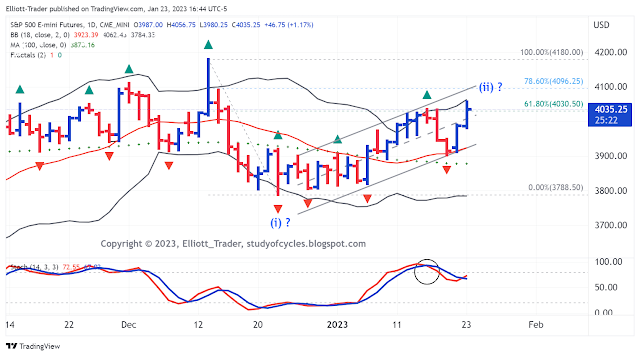
The daily chart of the ES is below. Today broke the prior high eliminating the nested (i), (ii), i, ii count for now. It is certainly possible that wave (ii) is extending, but it is not for certain.
In other words, today and maybe tomorrow 'may' prove to be a false breakout. But there is nothing lower until the fractals at the lower edge of the up channel are broken and there is a back-test that fails lower.
But, be careful, patient, and flexible.
Have a good evening,
TraderJoe

Neely just posted a new video (recorded in December 2022)
ReplyDeletehttps://www.youtube.com/watch?v=6u4kj_6zRpw
Thats really bullish.
DeleteThe problem I see in Neely's analysis is that with these 6 month charts, an error of 300 points does not seem important to him. He says that maybe his c:3 may not be over, and even if it goes down to 3600 before going up again, he would say that his analysis was correct. Too much of a "big picture" view for me.
DeleteIt is curious that maybe the two most famous wave analysts (Prechter and Neely) have such radical and opposing views.
Never understood his counts. A running correction were the e wave does not even attempt to come back into the wave it is correcting?
Delete6Q
Deletethat massive disagreement should tell you that elliott wave is snake oil
Neely is no longer practicing Elliott Wave, but NeoWave with all of its new patterns (diametrics, neutral triangles, etc.). His pattern with a non-overlapping (e) wave is such a pattern. He & Elliott Wave 'must' logically disagree because they are doing two entirety different things.
DeleteTJ
@Phil, I don't think it's snake oil. The point is to use the waves in the short term and have alternative systems to compare before making decisions. And I think that making a very long term forecast is an intellectual exercise but not an effective tool (at least for short term trading). The prove are the large number of supercycle tops that EWI has announced and they have failed for years. Indexes change, markets change, there are many distortions.
DeleteFor example, we now have the 0DTE options that take up a lot of the daily volume and distort the market a lot. Now we go from extreme greed to fear in a very few hours.
And thanks to what I've learned from following ET for several years now, I'm able to see when a move is impulsive or corrective and that alone is a big help, even if I don't know what the correct wave count is in the longer term.
Not sure about this but possible triangle in SPY 5 minute chart.
ReplyDeletehttps://www.tradingview.com/x/uUxlFHZh/
Actually, SPY 5-min meets the requirements of a contracting diagonal.
Deletehttps://www.tradingview.com/x/GKPDOeAT/
The triangle is very non-proportional at present.
TJ
..and in a 'contracting' triangle can not have the 'c' leg below the 'a' leg. The triangle 'must' actually contract. Hope it helps. TJ.
Deleteyw
DeleteGOLD 4-Hr: appears to be 'up-to-it' again.
ReplyDeletehttps://invst.ly/-3bd-
TJ
Reminder: MSFT, GE, Verizon, Visa earnings after the bell. Q4 GDP scheduled tomorrow morning. TJ.
ReplyDeleteFYI GDP is always released on a Thursday, will be on the 26th at 8:30.
DeleteSPY 30-min: prices breaking down a bit from up wedge.
ReplyDeletehttps://www.tradingview.com/x/pIDZ6ApW/
TJ
Msft earnings call was pretty bad.
ReplyDeletei should have waited. MSFT jumped $11 so i thought Nasdaq will keep rallying. sold my shorts SQQQ. sounds like later on msft gave poor guidance. ugh mad at myself. should have waited longer
DeleteIt's it possible this is a wave 4 of C? I don't like the rsi here for bears on the smaller time frames
ReplyDeleteIs it possible that this "false breakout" was just a "head fake", and we have now entered Wave iii of C (of 5)?
ReplyDeletehttps://www.tradingview.com/chart/SPX/PTFOWWnX-SPX-15-Minute-Chart/
Apologies for copying your ideas, TJ, but I'm just trying to gauge market direction. ;)
Wondering if we might be forming a larger diagonal?
ReplyDeletehttps://www.tradingview.com/x/WWhkVGqf/
Looks like it. Daily bb at 4080 on es, a spike through there tomorrow would be ideal for me.
DeleteGood eye
DeletePossible. I was looking at that, as well tonight. Or, it could just be the three zigzags w-x-y-x-z. Difficult to tell.
DeleteTJ
A new post is started for the next day.
ReplyDeleteTJ