I turned negative on U.S. equities in mid-January when I recognized the market was no longer impulsing upward. It may have seemed a bit too early then. If you have any questions you can see the post at this LINK.
I certainly did take lots of heat from readers who were sure we couldn't be in an Intermediate (B) wave but we had to be in some kind of third wave. But now you know why. I was always trained to "not worry about the last couple of percent". Sorry, but that is my training. I kept showing a chart that looks like the one, below.
In mid-January, we were near 3,330 and today the futures settled at 3,225 (or thereabouts). I kept showing a chart that looks like this one.
I certainly did take lots of heat from readers who were sure we couldn't be in an Intermediate (B) wave but we had to be in some kind of third wave. But now you know why. I was always trained to "not worry about the last couple of percent". Sorry, but that is my training. I kept showing a chart that looks like the one, below.
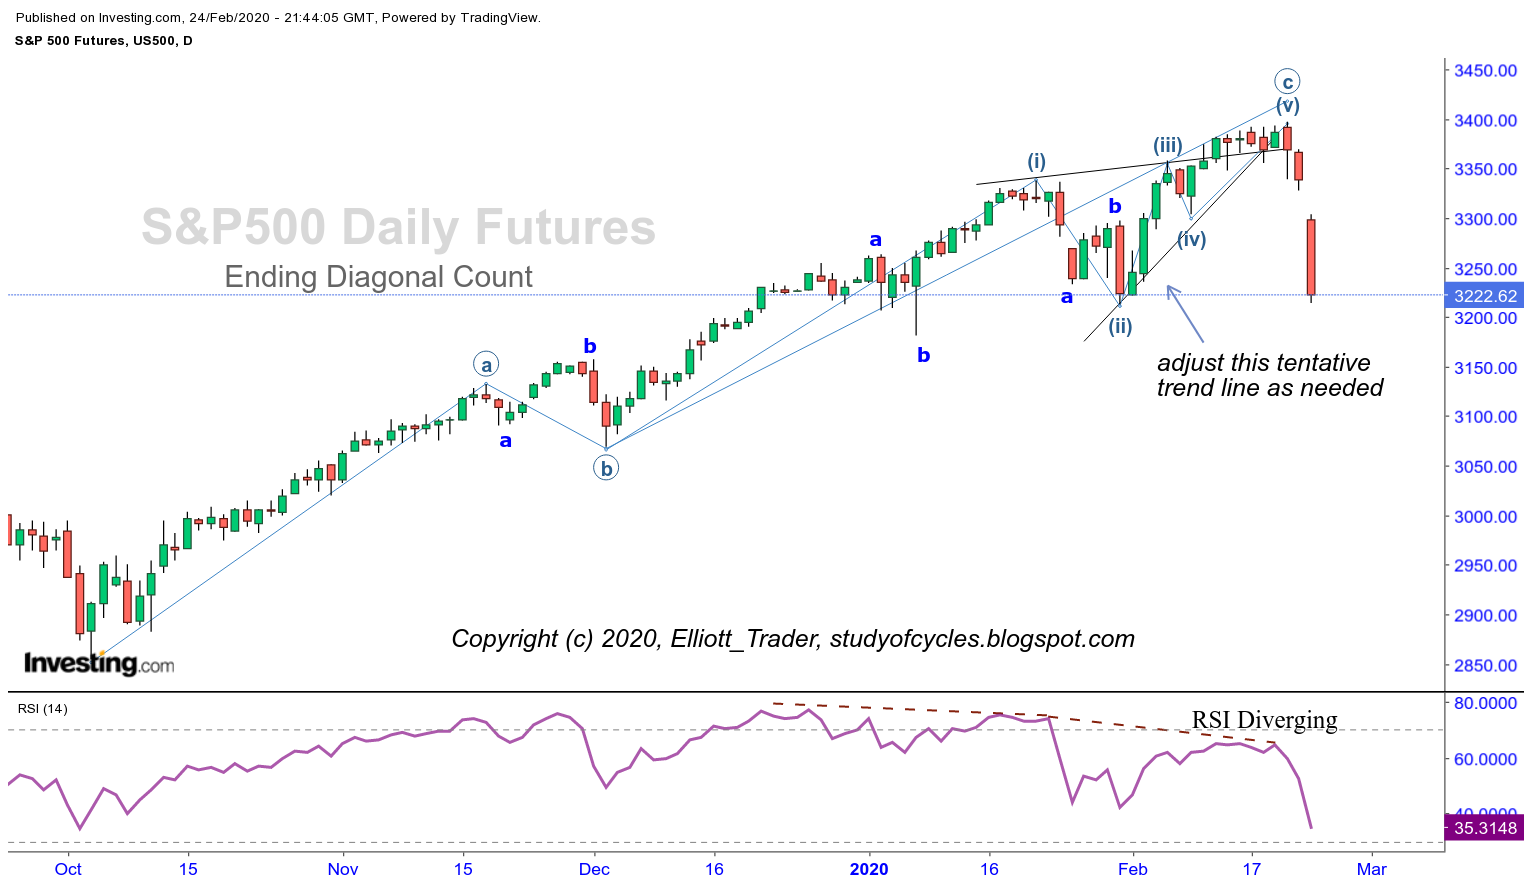 |
| ES Futures - Daily - Diagonal Count |
If the above count is correct, then wave minute ((b)) should be taken out in less time than the ending diagonal took to form. Today has a good start on it, but the only definitive resolution will be when a retrace wave does not exceed the all-time high.
For the DOW and the S&P500 there are two ways to make a longer term completed count. They are below.
For the DOW and the S&P500 there are two ways to make a longer term completed count. They are below.
 |
| ES Futures - Monthly - Ending Diagonal Count |
The significance of the above chart is that wave 5 of (5) got nearly as long as 3 without exceeding the length of 3 - as should be the case in a diagonal. If there is a further higher high, it would put this count in some jeopardy. If that happens, I'll provide the invalidation point. This same count could apply to the Dow Jones Industrial Average. As far as I can tell, it can not apply to the NDX or NQ 100 Futures - because the last wave is too long. But, that's OK. The NDX is a much younger index with a different composition and different history than the S&P500 or the Dow.
The other count is the one to Intermediate (B) that we have shown many times, and is available at this LINK. It's nice that I can just show you these charts again, so you can confirm what was being thought of at the time.
As interesting as this all is, confirmation - as stated above - is still needed. If the Ending Diagonal should play out, it would sound a pretty tough message to hear because the wave shown above would be an extended Intermediate (5)th wave, of an extended Primary ((5))th wave, of an extended Cycle V wave.
So, as usual, let's keep our wits, our calm and our patience about us. After all, we're just counting waves.
Have a good start to the evening.
TraderJoe
Thanks joe
ReplyDeleteIn the past you never would have allowed the second chart. Waves 1 and 2 of (5) have violations with (1) and (2). Did rules change or are they guidelines? Thanks marc
Huh? 1 of (5) is not longer than (3). And 2 of (5) is not longer than (C) of ((4)). I have discussed that in the past. Apologies ..earlier reply contained an error .. no morning coffee yet.
DeleteThanks Joe for the update.
ReplyDeleteIt looks like degree violations since wave 4 of (3) takes more time than (4) and wave 1 of (5) spends more time than (1) also
No james. You are comparing the waves 'backwards', and that is not how the market made them. See above comment, also.
Delete"a pretty tough message to hear because the wave shown above would be an extended Intermediate (5)th wave, of an extended Primary ((5))th wave, of an extended Cycle V wave."
ReplyDeleteThanks Joe. I think.
For the benefit of those still learning the ropes, if this view were to pan out (and even if not), when does your Cycle wave I begin? 1932? Earlier?
Just checking. b wave count was a fourth wave with all time highs after it completes it's high degree. Count above is completely different and no new highs it's end of many higher degree waves. The fact that we had only 3 waves down in 2018 and you at that time didn't have alternative count with acceptable wave degrees defaulted to a fourth wave with what turned out to be a massive b wave. Now we have acceptable count which simply extends your fifth wave from 2018 and it's possibly complete. With all that stated if we see a move down how do we know if it's end of fourth or beginning of big bear? Do you have preferred count if we see 5 waves down?
ReplyDeleteThat question puts the cart before the horse. There will be time for that later. Clearly, above, I said we 'must' get confirmation by having a retrace wave that does not exceed the high. Until that happens ...
DeleteCentral Banks have been routinely violently negating bearish market signals for years. Every trader has noticed and the list of examples is long, a few of which I previously mentioned. These signals were seen mostly on hourly, daily, and occasionally on weekly time frames. I have seen only one instance of a monthly bearish engulfing candle being negated. Can they pull off another?
ReplyDeleteWe have monthly shooting stars across many indices...
10 minute running ES triangle since Sunday at 3:00 am?
ReplyDeleteI would have it at since Sun at 6:AM .. but I was eyeing the same structure this morning.
DeleteThx ET!
Delete..just in case others don't see it, I'm including a link below to the pattern under discussion.
Deletehttps://invst.ly/pyjuh
One thing to be a bit cautious about is that there seems to be a lot of complexity in the pattern.
TJ
ES futures have the new low; possible to count 'five waves down' when this wave completes - thrust out of the triangle.
DeleteBest count might look like this on the ES 30-min with about 160 - 170 candles and EWO.
Deletehttps://invst.ly/pykyw
TJ
Two 'daily' fractals back have now been exceeded lower. This could be a 'stop runner'. Chart to follow.
ReplyDeleteChart of second 'daily' fractal back being exceeded lower.
Deletehttps://invst.ly/pylna
TJ
ET, can an ending diagonal finish with a 5 failure, above 3 in bearish case ? Thanks in advance.
ReplyDeleteLooks like a nice clear 5 waves down.
ReplyDeleteET can you show your count on ndx since 09 which I have been asking for many times
ReplyDelete@Erik, I'll do you one better, but you won't like me any more for it. Oh, and what says I owe you anything for 'free'?
Deletehttps://www.tradingview.com/x/bS8K74k7/
TJ
i have 40% chance the all time high was a B wave high and C is done already or <1% more downside.
ReplyDelete5 min ES contracting triangle in the works?
ReplyDeleteTextbook impulse - https://invst.ly/pymte
ReplyDeleteI was please wondering your thoughts on possible degree violations where Wave (1) and (2) from 2009-2011 are smaller than sub waves 1 and 2 of (5) that started around 2016-2018?
ReplyDeletePlease see the first comment above at 8:43 am.
DeleteI always go with the KISS approach. From 12/24/18 to 5/1/19 there was a 19 week corrective rally. That was followed by a contracting triangle that ended on 10/3/19. That was followed by another 19 week rally which ended exactly at the apex of the converging trendlines of the contracting triangle, which is exactly what breakouts from contracting triangles are supposed to do. Seems like typical EW 101 stuff to me.
ReplyDeleteIm on the phone but think this would be 5 of CED on ES.
ReplyDeleteCan't believe Joe is trying to claim he's called this.
ReplyDeleteJust Friday he was predicting a bounce, a brief dip, then new highs.
Talk about flexibility,EW is great, just change your count after the event.
Crazy times.
@dw - I did 'not' call the gap down. And I went negative in January. I can't believe 'you' are criticizing something you didn't even contribute to. No charts from you. No opinions from you. No work from you. Just ranting.
DeleteOther market EW analysts - such as Todd Gordon - were calling for a 'massive' third wave up. He specifically said, "this is the third of a third .. I gotta ride it.!" I did nothing of the kind.
I'll stand by my work, Criticize it all you like. I was completely ready for downside movement.
TJ
Only one of us appears to be ranting, and it isn't me, and I have shared some charts and links too.
DeletePlease re-read your post from Thursday and Friday, you were expecting new highs, not further declines as we are seeing.
You ditched the count that called for a plunge and went with the 'sell in May' option instead. Then changed again to expecting a marginal high again in early March.
AT least be honest, we all read your posts, and no way you were loaded with short trades on Friday, not based on your count at that time.
Looking for one last wave does not make one bullish.
Delete@dw .. 'looking for' one new high from a "wave counting perspective" is not the same as not "being loaded up on short trades". I have stated here before: I like to sleep. I do not trade the overnight, unless it is really small and I am comfortable from a wave-counting perspective.
DeleteMaybe when I am expecting 'one last wave' I either have no positions at that time - or I have a small one, and am just waiting. Rest assured I do what 'I' am comfortable with - not with what other people tell me to do.
Maybe you think I need to be telling what to do from a trading or investing perspective. I don't. I won't. Your decisions will be yours.
I will remind you that Ira Epstein - whose words I paraphrase to you all continually - does not recommend taking trades at 'all' unless they are in the direction of the 18-day SMA - below the 18-day SMA in this case.
He has patience. You should too. In fact, I'm beginning to lose mine with you. Either 'quote' the entirety of my body of work, or, your posts will just go to the trash can.
TJ
..and what I can guarantee you is - unlike Todd Gordon - and others, I had 'no long trades to unwind'.
DeleteTJ
At 3,165 ES has now touched the 100-day SMA and is beyond the lower daily Bollinger Band with the %D of the daily slow stochastic in over-sold territory. 'Typical' guidance from someone like Ira Epstein would be "Smart Money likely lightening up in this area after two targets are reached."
ReplyDeleteThere is a Dec high at 3,157 area as well.
This is for information purposes, and not to be taken as trading or investment advice: just a paraphrase of what Ira Epstein would discuss in a daily video.
TJ
you have dona a great job. i think you need to differentiate between "counting" and posts like the links you are referring to - i assume we should always defer to any longer term posted count?
ReplyDeleteWell, the only thing I can guarantee you is that I will absolutely not get every smaller wave correct. There are too many ways corrections are made - something I covered in "The Fourth Wave Conundrum". There are thirteen ways corrections can be made. The odds of an unskilled person getting it correct 1:13, and the odds of a skilled analyst about 1:3.
DeleteIt's all about probability, and so the longer term waves take precedence. Tell me this, 'who' exactly predicted the Corona Virus? I mean anyone scientifically knowledgeable can have guessed "the rise of the germs" will accompany global warming. But who predicted this episode 'now' and to this extent? No one. Not a single person. The "big money" was just complacently watching their stocks go up. Rather than gearing up for an economy where we need to learn to prevent disease transmission in a hurry.
TJ
"But who predicted this episode 'now' and to this extent? No one. Not a single person."
DeleteActually, Peter Temple has been posting fairly reasonable EW counts, and highlighting Climate, and the Rise of Pandemics. And he's been doing that for the last year or two, at least. Not due to Global Warming, but Cooling. He frequently cites the cycle work of Ray Wheeler. He has a dogmatic style that rubs me the wrong way, but I get his drift. Most of the papers I do TRUST on Climate Science go the other way - end of Holocene Interglacial and back toward Glaciation. But only pro Warming papers are supported with grants, so that's what media reports. Honest science is gone; you have to think for yourself.
From January
Deletehttps://worldcyclesinstitute.com/the-pandemics-begin/#more-21195
I will not opine on the climate, but the analyses of this gentleman from worldcyclesinstitute are not EW, because he violates very often all the rules.
DeleteAwesome that there are people that pay for his charts.
6Q ... Temple has made it clear that he does not subscribe to F&P's reinterpretation of Elliott's work. He has spelled out some of his differences. RNE is no longer around to clear any of that up. The market has the last word.
DeleteES overlap at 3,157.75, the Dec high. Prevents calling this a "fourth wave" from that location. Bulls have to now 'hope' their wave 1 was at the September high. But from what I can see that implies 'all kinds' of clear distinct degree violations.
ReplyDeleteTJ
Now overlap on the November 19th high. Bulls lose another location.
DeleteET, Do you have a count coming out of triangle?
ReplyDeleteET, based on what you've seen, would you "expect" the next wave down to be 1.618 or more of this one? And would it more likely be a 3 or a C and why? Thank you.
ReplyDelete"this one" meaning the past 5 days
DeleteI'll try to cover that tonight.
DeleteFeels like extended 5th of 3rd
ReplyDeleteHere's a short term ES 5-min since the (e) wave of the triangle.
ReplyDeletehttps://invst.ly/pyoii
TJ
..there's a new low
DeleteTHX Much!
ReplyDeleteA new post has been started for the next day.
ReplyDelete