 |
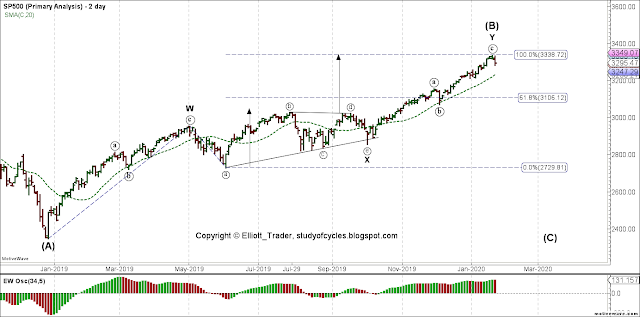
| S&P500 Cash Index - Two Day - Y = W |
You'll also note that - in terms of "fit" - the usual expectation for a triangle target was met today. You take the widest width of the triangle and add it to the break-out point. The arrow on the right is just copied over from the one on the left. Picture perfect.
It's been a tortured, twisted, halting, grinding, count upward. I turned negative in the comments a couple of days ago. A bit too early. Or was it? Unfortunately, nothing about the long-term contracting ending diagonal scenario invalidated. The only difference is that you see wave ((a)) of Y as the extended first wave of the impulse for ((c)) of 5 of (5).
Probably because there is a little more room in the Cycle V diagonal count (shown in previous posts), the only thing that might convince me it was favored over the Intermediate (B) count, above, is a further higher high - to make five waves up.
Either count suggests a move down to the lows of Intermediate (A).
Here is how that last wave up ended from the Iran Tensions low on January 7th and 8th, as best we can tell since there is now a critical overlap in this chart. Either location you use for wave i results in overlap today, ruling out a further fourth wave location within this sequence.
 |
| ES Futures - 2 Hr - Divergence at the Highs |
Right now our task is to count the downward wave as best we can. This is done using the ES 5-min chart, as below.
 |
| ES Futures - 5 Min - Five Waves Down |
As best we can tell - using the principles of degree labeling - the third wave is the extended wave in the sequence. It is longer than i, or v. At this point the retrace wave looks sub-standard in terms of both time and price, so we may see more to that in the Monday session.
Have a great start to your weekend.
TraderJoe
Can you clarify this degree violation thing? Because from what I see in the above chart some internal subwaves of 2 are longer than 4.
ReplyDeleteDon't mean to be nitpicky, but if I keep seeing these violations then I'm not going to treat it seriously as a firm rule, at least for the corrective waves.
I don't know which chart you are referring to and exactly which 2 and 4. Please use the same symbols I do. If circle-2 and circle-4, then use ((2)) and ((4)). The double-parentheses means "circle" in text.
DeleteYay, wave C, here we go.
ReplyDeleteThat perma-bull was a classic sign recently wasn't he?
If the W-X-Y is the (B) wave of an extended flat, wouldn't it be typical for the (C) wave to be 1.6 x the (B) wave to the downside which would be SPX 1700 area?
ReplyDeleteIt very well 'could' be. But, let's make sure we get out of this up wave, first. That will take over-lapping the ((a)) wave, and trading below the ((b)) wave.
DeleteI suspect penetration of the A wave high around 2940.91 will be fairly convincing...if we have a top I think we may get there a whole lot faster that some folk expect....
ReplyDeleteThe overlap on YM futures, and pretty clear 3 wave move in (iii) might indicate that we'll get a small diagonal for ((c)) after all?
ReplyDeletehttps://invst.ly/pmqr8
I know you are speaking about the dow futures. Just be aware that on dow cash, wave four would already be longer in price length than wave two. That would seem to lower the odds quite a bit, as it would rule out the formation in cash.
DeleteI suspect the Dow futures may have suffered a small truncation like this one at the red (*). The reason is that iv breaks the 0 - ii trend line, and the retrace is very nearly 78% or more.
Deletehttps://invst.ly/pmrn1
If, as an alternative, one tries to make the current wave an ending diagonal, with a-b-c to where iii is, then the time from iii to the current 'a', shown, is likely to be 'longer' than all of the time in the previous correction. That means the current move down from the high should not be a subwave two of a larger diagonal: it would be longer in time than previous one-larger degree wave.
I'm saying 'should' here because this needs to be tested.
Maybe ((a)) ended 19/11 which gives more time to ((b))? If not, isn't "time" just a guideline? Right now iv of diagonal is shorter than ii in price, but if YM drops 200 pts on Monday this diagonal breaks down so let's see :)
Deletehttps://invst.ly/pmrx8
no.. it's still the wave from (c) to 'unlabeled', that is longer than the prior (c) to unlabeled.
DeleteHere's a labeled chart, what's longer than what?
ReplyDeletehttps://invst.ly/pmsxp
Wave (iv) as you have labeled it is longer in 'time' than (ii), which is the opposite for the 'expected' behavior in a contracting diagonal. 'Usually', not always, contracting diagonals contract in time as well as in price - whereas expanding diagonals 'expand' in time and price.
DeleteYou'll note that the trend lines for the diagonal are stilted. In other words, waves (i) & (iii) do not form a single trend line for the fifth wave to have the characteristic 'throw-over' of.
Further, you'll note that wave (iii) does 'not' have the characteristic divergence on the EWO.
These things do not 'positively rule out' an ending contracting diagonal, but they make it much, much lower probability.
Also, see the next day's post - which is already up.
TJ
Thank you, this helped alot
DeleteThank you, this helped alot
DeleteA new post has been added for the next day.
ReplyDelete