Friday, December 9, 2022

Higher High Day - 2

The ES daily chart made a higher high and a lower close. Today was PPI (Producer Price Index) Day, and the futures were higher before the open, then tanked on the PPI report, then rallied to almost 80%, then fell off again into the close on much higher volume. The daily chart is below.


My understanding of the swing-line indicator is that this allowed the line to continue higher for yet another day - as shown.  A low below Wednesday's low is needed to change to a down-trending rather than a neutral reading for this chart element.

The daily slow stochastic is still in over-sold territory. The Bollinger Bands are still traveling sideways, the swing-line remains trend-less, and price settled under the 18-day SMA, so the daily bias is down again. Today made the fourth consecutive day that prices closed below the lower parallel trend line.

The bumpy and whippy conditions continue. The CPI report is currently scheduled for Tuesday of next week before the market opens.

Have an excellent start to the evening and the weekend.

TraderJoe

Thursday, December 8, 2022

Higher High Day

Today the algorithms spent most of the day doin'-the-deed after making a higher high before and after the cash open. So far, ES prices have backed up towards the prior price channel in a higher high day. But this does mark three daily closes below the lower parallel. The daily chart of the ES futures is below.

ES Futures - Daily - Higher High Day


My understanding of Ira's swing-line indicator is that this has the effect of moving the swing-line up at least temporarily (as shown) but there is "no trend" established because there was a higher high followed by a lower low (yesterday's low) and because prices closed below the 18-day SMA in any case. A new lower low day - lower than yesterday's low - would be needed to begin a trend towards lower prices, provided the day does not turn out as an outside day up.

As things stands there was still no new upward overlap of concern on the intraday charts.

The daily slow stochastic remains in over-sold position, and the daily Bollinger Bands are narrowing which indicates at least some consolidation. Tomorrow morning is the PPI report before the market opens. Bumpy conditions can persist.

Have an excellent start to your evening.
TraderJoe 


Wednesday, December 7, 2022

Second Close Below Parallel

Today was a fairly narrow range day and might represent some of all of wave iv from yesterday's intraday chart - see LINK here. As of this time there was no upward overlap on wave i of the potential impulse. The daily ES futures did make a new daily low early in the morning, but then they formed a doji by the close of the cash market and price is still fighting at the 100-day SMA. The daily chart is below. Today was the second close below the parallel, and the close is still below the 18-day SMA so the daily bias is still down.


Tomorrow could be another whippy day. It might start lower on comments from the ECB (Christine LeGarde, see Economic Calendar) or the weekly jobless claims and - based on the wave count - it might then whip around higher, perhaps after testing the lower daily Bollinger Band. We don't know for sure; we just surmise from 1) the wave count, 2) the news, and 3) the market's position relative to the band.

The daily slow stochastic is in over-sold territory, so the market might have a bit more down-side but would not like attract the new positions of the so-called Smart Money. Rather, the first hit of the lower band, in conjunction with the 100-day SMA, is where the Smart Money may merely take some profits and wait to see what occurs next. The Bollinger Bands are beginning to narrow in a bit, so some consolidation might follow.

We note that the 18-day SMA ("the line in the sand") is still above the 100-day SMA, and it has not crossed lower yet. If it were to do so, it might provide more confirmation of a market turn lower.

Have an excellent start to your evening.

TraderJoe

Tuesday, December 6, 2022

Plausible - Extended 1st Wave?

Is the diagonal already complete, and now morphing into an impulse? Here is the ES 30-minute chart with this wave counting idea shown. The symbol i means the first wave would be the extended wave, the longest wave in the sequence in price.

ES Futures - 30 min - Completed Diagonal Morphing to Impulse?


When looked at using the futures, the third wave of the diagonal ((3)) does not look as awkward as it does in cash with this count. The fifth wave of the already completed diagonal ((5)) would have stopped short of the lower expanding diagonal line - just as the literature reports several do. Although I am showing a close-only chart so that form may be studied, the idea has been checked on OHLC charts and it works there, too.

The very substandard second wave retrace (less than 38%) would fit with a second wave only if the first wave is the extended wave in the sequence. So far, wave iii is shorter than wave i.

We would now be in the fourth wave iv in the overnight session. If the diagonal is now morphing into a true impulse, then overlap should be avoided as indicated. Otherwise, a larger diagonal is likely being formed. But if a true impulse results, it has some benefits a larger diagonal does not.

Have a good rest of the evening,

TraderJoe

Monday, December 5, 2022

Plausible Minute ((b)) - Circle b

Friday's hanging-man candle in the futures did get confirmation lower today. U.S. equities as measured by the SPY cash ETF opened with a gap lower, and followed-through. First, a reminder of the weekly count.


Prices fell off of the upper dashed expanding diagonal trend line in an interesting sign. Now on to the plausible daily count.


The count of a (c) = (a) zigzag with an expanding ending diagonal for the the fifth wave, v, of (c) would expect to see prices drop below the start of the diagonal at the 390 level in less time than the diagonal took to form. The Fibonacci ruler shows the (c) = (a) level.

As of yet, price has not dropped below the dashed lower uptrend parallel. It needs to do that, and back-test that line and then fail the back-test with a lower low candle. Again, I am not in love with any particular up count at the moment. This one has some strengths to it in that it would follow degree labeling considerations. If you also called it (y) = (w) I would see no reason to argue.

I would also just add that as of the cash close, the ES futures daily slow stochastic was no longer embedded. This needs to be watched for the next day.

Have a good start to the evening.

TraderJoe

Friday, December 2, 2022

LTMD - Let The Market Decide

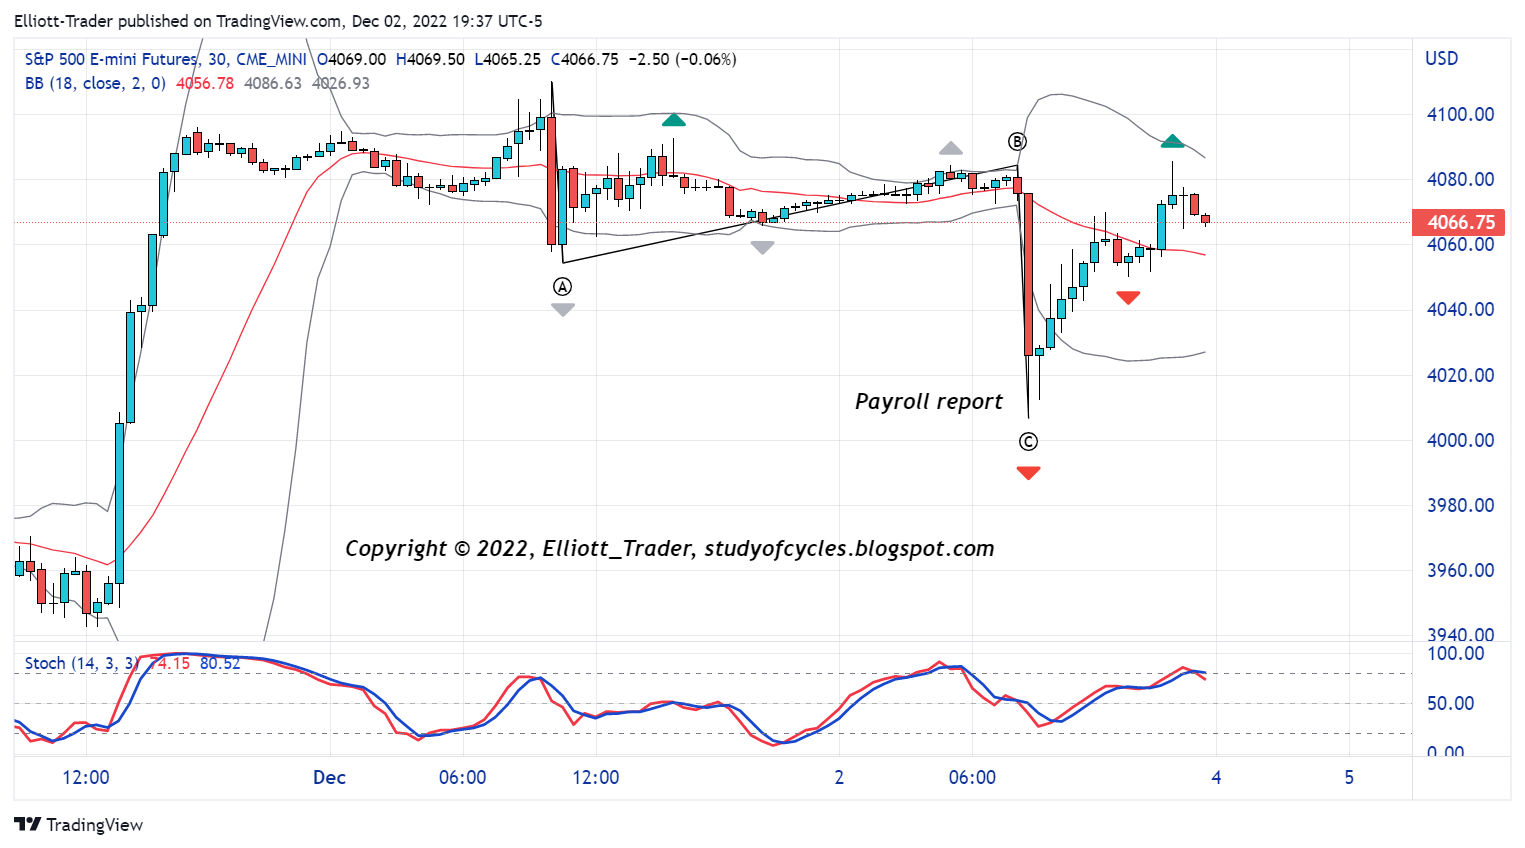
Daily ES prices continued to close above the 18-day SMA. Therefore, according to what Ira teaches in his public videos, the price bias remains up. The daily slow stochastic is still embedded. Therefore, the so-called Smart Money may still try for the upper daily Bollinger Band. They didn't do it today. They might have but it didn't happen. So, let's go down to the Intraday Wave-Counting-Screen, which mirrors on the 30-minute timeframe the same guidance as for the daily chart.


Here you can see the spike down in the futures which accompanied the Payroll report. Following this wave which was only about 1.27 x as long as the first wave down, there was not a fourth and a fifth wave down. The payroll candle took out the two previous down (grey triangle) fractals.

When prices turned and hacked & hacked higher, they initially created an upward wave which is followed by a down (red) fractal. However, price ended over the 18-period SMA, and so even the intraday chart ended with a positive price bias. The intraday slow stochastic is over-bought and not embedded at this time.

In the futures - besides the top being its own up (green) fractal - there are two other up (green) fractals that have not yet been broken.

We have tentatively labeled the down move as an ((A))-((B))-((C)) down. That's all there is. A fourth wave higher that did not overlap did not form, as neither did a fifth wave lower.

At this point, if one were to draw Ira's swing-line on the intraday chart, it would be indecisive because there is a lower low and a higher high at the end of the day. Because of this indecision, one of the best strategies is to Let The Market Decide at the moment which way it wants to go.

Yes, we can make arguments that we may have started a diagonal downward, as in ((A))-((B))-((C)) of a wave i, downward, and that the afternoon high is a wave ii, upward. But the upward wave may be completed, or it may not be. The jury is still out.

And, just like we can make an argument for a downward diagonal, we can make a good case for a triangle pattern, too, that might lead to higher highs.

So, watching those fractals for a bit might be an excellent strategy. If the first down (red) fractal back is broken it is only of minor significance because until the morning low is broken, a FLAT wave could also occur - still making new highs eventually.

Fractals are the location where the markets make decisions. You can try to out-guess them if you want. That is up to you. But remember where the daily bias is pointed. And if you chose to fight it, then at least recognize clearly you are fighting that bias, and it is you that decided to.

Otherwise, although today is known as a "hanging man" candle day, there is no confirmation of that candle until a new daily low is made. Isn't it interesting how that fractal at ((C)) and the confirmation of the hanging man would likely be at the same place??!!

Also, keep in mind that if a diagonal downward takes place, it could have two forms: either a contracting diagonal or an expanding one. And, typically, if the third wave lower is in the contracting form, then it would be shorter in time, while if the third wave lower is in the expanding form it would be longer in time - another excruciating drip-drip-drop.

But, further, looking at daily seasonals, since Tuesday is often (not always) a turn-around day, then if there is a triangle into Monday, the prices could pop on Tuesday to then make a better full-reversal bar. Nothing like that exists on the daily chart yet.

So, be cautious, be careful, be patient, keep your wits about you. The volatility is difficult to deal with, and the wave count is only of secondary usefulness right now to outline some of the shorter-term risks. Hopefully, some clarity will be provided soon.

And remember, Ira does not recommend outright short positions until below the 18-day SMA. This is in order to get the wind at your back if at all possible.

Have a good start to your evening and your weekend.

TraderJoe

Thursday, December 1, 2022

Driving Miss Crazy - 8

It remains an extremely difficult up count. Here is the chart of the ES 8-hr futures. Price would still be within (c) = (a).

ES Futures - 8 Hr - Zigzag?


The alternation would be diagonal (a), impulse (c). The (c) wave would have a very long-in-time wave iv to alternate with the short, sharp wave ii.

Again, nothing says the up wave is over until/unless the lower parallel trend line is both broken and then back-tested with a new low after a failure.

Have a good start to your evening.

TraderJoe