Monday, April 9, 2018

Ground Chuck

Market Outlook: Now Getting Higher Volatility
Market Indexes: Major U.S. Equity Indexes closed higher
SPX Candle: Higher High, Higher Low, Higher Close - Gravestone Doji Candle
FED Posture: Quantitative Tightening (QT)

In Saturday's post, we warned to be very wary of more whippy action with a down-side bias, using a phrase we called "a meat grinder". Today lived up to that description. Looking at the updated hourly chart of the S&P500 cash index that we posted on Saturday will show why.

S&P500 Cash Index - Hourly - Smaller Triangle Holds

The S&P500 index had closed Friday at 2,604. Futures prices had been higher overnight, and so the cash market opened up +13 points at 2,617 and proceeded to rise all the way to 2,654. Clearly, that was up +50 points from Friday. 

At that point in the live chat room we stated "market having trouble with the 2,650 level, and 2,654 is the 78% retrace on the prior wave". That level is shown by the red arrow on the chart above.

At that point, the market began rolling over, and cash fell all the way down to 2,610, down fully, 44 points from the high, and it closed up only +9 points on the day. As to whether this potential e wave, and subsequent (b) wave, up, is over, we can only show this chart of the ES E-Mini Futures on the day, which we also showed in the live chat room.

ES E-Mini S&P500 Index Futures - 30 Minutes

As best we can tell, price traveled up in a channel, and then broke down out of the channel, breaking the down fractal, shown in red, at .b, as well. To put it plainly, that was not a good sign for those who are exceptionally bullish. It was a poor close, and price is back below both the cash and futures EMA-34.

On the hourly cash chart, the e wave did make it's target of closing above the hourly EMA-34 for good form and balance. And so a triangle may be completed here. One caution is that e waves of triangles can become more complex if they want to - sometimes they turn into smaller triangles themselves. That might allow an e wave to become longer in time, but not higher in price.

IF the hourly triangle in the first chart is completed, then with some backing-and-filling, it is possible the recent S&P500 April lows will be exceeded lower - as was discussed in the Saturday post.

For now, have a very good start to your evening. We hope we were of some help in judging the current situation.

TraderJoe

Saturday, April 7, 2018

Careful of a Meat Grinder

I do not mean to be facetious, but the best characterization of this market at the present time is "whippy, with a downside bias".

So, let's talk only about "what we know", and "what we don't know", and let's see what the evidence tells us.

We know that the Dow Jones Industrial Average made a new low over it's February 9th low. That is no longer in keeping with the large daily contracting triangle. We also know that, at the same time that the Dow made it's new low, the S&P500 cash index reached the 90% level. That is often consistent with the formation of a FLAT, or the next impulse lower.

We also know for a fact that the S&P500 cash index fifteen minute chart (from Friday's blog post) made only three waves up following the rigorous approach of The Eight Fold Path Method from the April 2 low, to the April 5 high. We also know, using measurement, we can count the down waves from the March 13 high as a five-wave sequence without a degree violation. We showed that on the blog post of April 4th (morning).

Now, let's post an hourly chart of the cash S&P500 index and see what else we can tell for sure.

S&P500 Cash Index - Hourly

First, I have labeled the three waves up referred to above from April 2 to April 5 as the small degree three-wave sequence, wave .a, .b. .c. in keeping with the chart we showed on Friday. For clarity on the charts the .c waves are not shown, they are understood.

That being the case, there are two other things we know. They are, first, that the wave sequence down from March 27th to April 2nd is also a three wave sequence - also labeled as .a, .b. .c. And, second, we know that the shorter up wave sequence from March 23rd to March 27th is also a three wave sequence. No matter how much one's eyes try to make that wave sequence a "five", we know that lower prices, not higher prices followed it. So, the best count is as of a "three". Further, shorter term examination of this wave will show it also does not follow The Eight Fold Path Methodology.

So, now that we have covered what we know, we can discuss what we don't know. First, it is possible to label the downward sequence as a minuet (a) wave of a zigzag that does not break the low. Then, it is possible to label the three-wave sequences either as a,b,c,d of a potential running triangle. Or they may be re-labeled as w-x-y of a double combination whose purpose was to take up time and move price sideways, where w = a, x = b, and y = c. So, it is entirely possible that a (b) wave ended at the location on the chart shown as c.

But, if the wave is a double combination, then the y wave was a failure wave. It did not cross above the a wave high.

Next, we do not know the d wave, downward, is completed. It might be, but it does not have to be. Still any three-wave up wave from here, whether in fact a second wave, or a potential e wave, will give the structure following the (a) wave, the "right look" for a running triangle.  And, we can ask the question, "with all the bad news on Friday, including tariffs and poor job growth, why weren't the lows exceeded?" Could it be the market is waiting to properly form a triangle?

Remember, for a triangle to form properly, the potential e wave must end above the (a) wave low. So far, that is not a problem. And, from the standpoint of form and balance, it would be best if the e wave ended above the blue hourly EMA-34 shown on the chart. The latter condition is a nice-to-have, and not a requirement.

In either case, double combination or running triangle, it would likely mean that the early April low on the S&P500 will likely be exceeded lower.

And, if we get a second zigzag downward that marginally breaks the lows, we may be getting an contracting diagonal wave lower overall on the daily chart. Let me sketch out what that might look like.

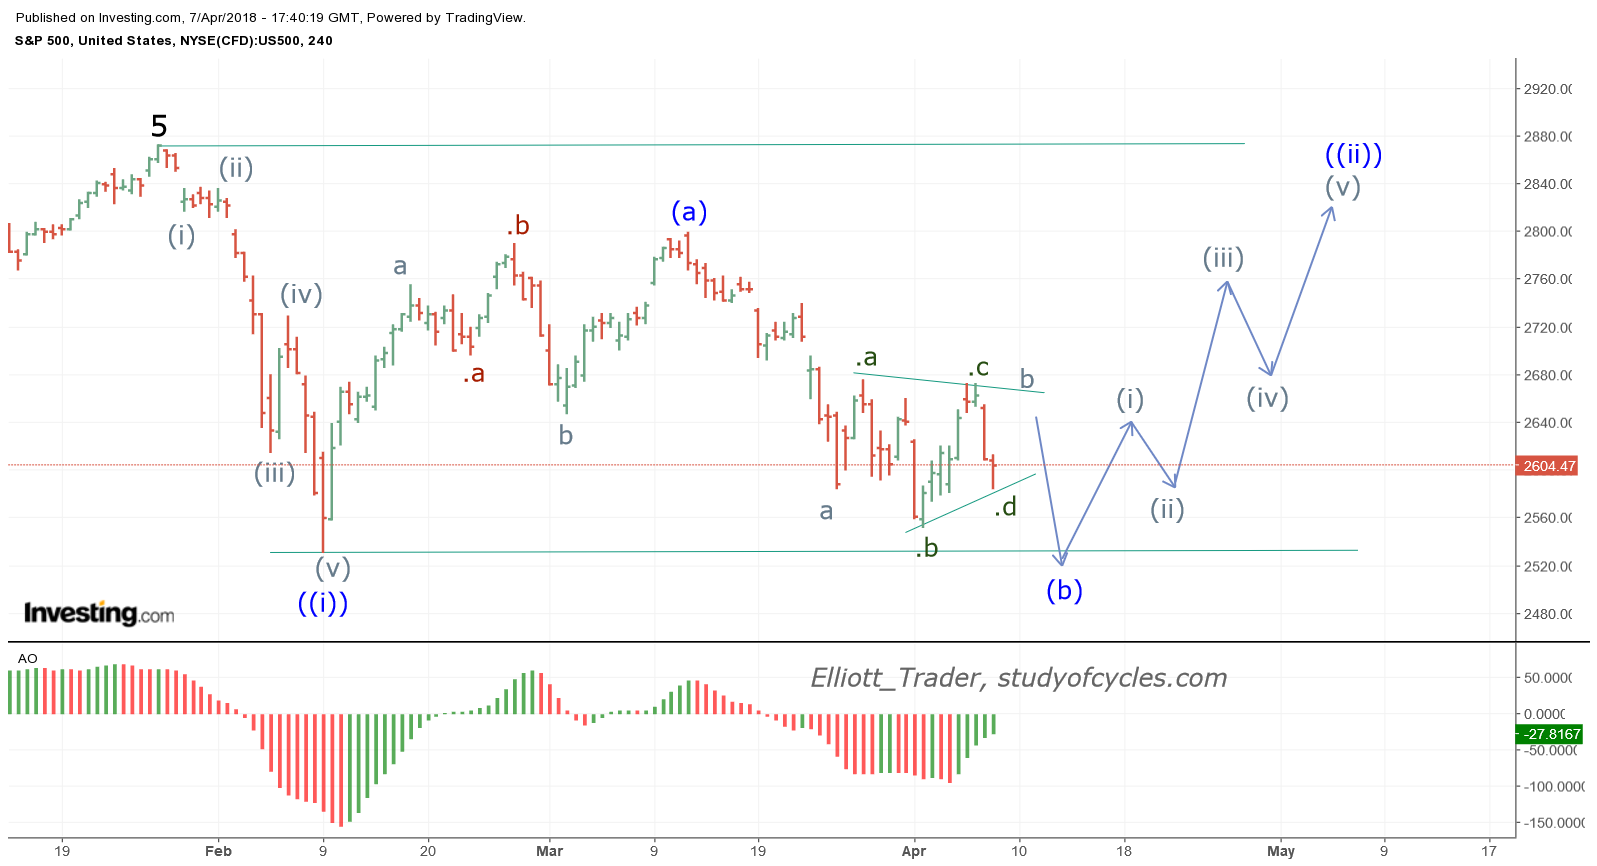
S&P500 Cash Index - 4 Hr Chart - Potential Diagonal

For this count, then minute waves ((iii)) and ((v)) must make required slight lower lows, yet remain shorter than wave minute ((i)), down. Further, minute waves ((iii)), ((iv)), and ((v)) must all form as the required zigzags.

And, I will also show the best alternate for this count, as below. It is the double zigzag.


S&P500 4-Hr Chart - Potential Double Zigzag

So, let's look at these two alternates, and again, using what we know or can plainly see decide which of these two might have the better chance of occurring. Here are some additional things we know.

First, the second down leg to ((iii)) or ((y)) has taken more time than the down leg to ((w)). While not fatal for a contracting diagonal, usually, most often, contracting diagonals contract in time - as well as in points. In other words, ((w)) or ((i)) should have taken the most time. It hasn't.

Second, we can note the Elliott Wave Oscillator (EWO, or AO on Investing.com), and observe that is it presently diverging, and it might diverge further if a marginal new low is made. While that is a key signature of a contracting diagonal, then wave ((iv)) up, of the diagonal count would be required to have it's EWO or AO to be less than the peak of wave ((ii)) for the diagonal to agree with the momentum indicator. But, it is also possible the divergence sparks an impulse wave up, and that could mean Minor 4 ends at the low, and Minor 5 heads higher. That Minor wave 5 could be a gap filling wave, and so it's importance is not to be taken lightly.

Third, don't forget we know that potential Minor 3 is a 2.618 wave x Minor 1. And that is more evidence we must stir into the mix. And it favors the double zigzag count.

Finally, while we don't know for a sure if the smaller triangle is forming here, we must ask, "IF that triangle does form here, why would it be forming right here?" Triangles usually precede the last wave wave in a sequence. If so, that would mean a contracting diagonal lower could not form. If only that sideways double-combination forms, then a contracting diagonal could form.

So, while I apologize for presenting the case for which there is less evidence first, it is my clear intent to show you how knowing the different styles of Elliott Wave patterns, and how their alternates form from each other, can help you weigh the evidence for yourself. At this point, there is slightly more evidence for the second pattern than the first, but I would still rate them at 30:50%, and therefore I have literally no interest in which pattern forms. I just remain neutral and objective.

Now, the smart ones among you will shout, "wait, TraderJoe, your probability didn't add up to 100%!, so then aren't you saying it's possible an Expanding Diagonal is forming downward also?"

If you asked that question, then "bingo!". Give yourself the prize pot.

Yes, an expanding diagonal or even an expanding triple zigzag lower (its alternate) can form from this location. After all, it's middle leg would be longer in time as is usually seen in an Expanding Diagonal.

But, then, in that case wave ((iii)) or ((y)) must become longer in price than wave ((i)) or ((w)). And that has not been seen yet. And further, it's EWO would be lower than that of wave ((i)) - which it is simply not, at present. So, we give that a rating of 5%, and watch to see if it occurs.

What about that larger daily triangle? Still possible in indexes like the NQ or the RUT, but likely not in the Dow, because of the lower low. And getting exceptionally less likely in the S&P500 because of the 90% measurement, and because of the current wave structure. It is very hard to count a completed zigzag down from the March 9th high in the S&P500 cash index. Still, it is just barely possible if the down wave falls short of a new low it could form in this index, too. So, we will leave that probability at 10%, too. So, here's what we have.

Double zigzag - 50%
Contracting diagonal - 30%
Larger Daily Triangle - 10%
Expanding Diagonal - 5%

Please keep in mind that 10% probabilities do not rule out a pattern. Events with only a 10% chance happen all the time - like every time price closes outside of a Bollinger Band (which only has a 5% probability). All it takes these days is a properly placed news story or an ill-timed tweet, apparently.

Wait a minute! The devil, you say, there is still 5% left over? You Bet! What if wave ((i)), or ((w)), down, is actually a "five", and not a "three". Then, a similar wave structure in the second chart can be used to justify, ((i)), down, and a FLAT to a minute wave ((ii)), just with a five-wave sequence up that does not exceed the high. For clarity, let me again draw that pattern out.


S&P500 Cash - 4 Hr Chart - Flat Wave ((ii))

There are three likely problems with that count. The first is the 5 label at the left. Possible? Yes. But as to good form and balance in the weekly wave structure - a bit less likely because of that 3 = 2.618 x 1 measurement that we have talked about so often. The second one (which is less fatal for the count) would be that one or more of the gaps might likely not fill from wave ((i)) down. And it means they would not fill for years. And the third problem is that the whole up wave, wave ((ii)), would be taking an extraordinary amount of time in relationship to the first down wave ((i)). Again, this is certainly not impossible but looks very odd for a significant down move.

So, now the probability table looks like this:

Double zigzag - 50%
Contracting diagonal - 30%
Larger Daily Triangle - 10%
Expanding Diagonal - 5% 
Flat wave minute ((ii)) - 5% 

And now the probabilities add up to 100%.

Step by step the market will uncover its pattern. In the meantime, more volatility is expected - lately that volatility has been occurring in the form of internal flat waves. It makes wave counting almost  a form of mental torture, right now.  But, none-the-less, that is the task. Be patient, be flexible, be calm, and we'll get through this. 

Remember, this is The Fourth Wave Conundrum that happens at every degree of trend. And it really reflects that, in every wave, at all times, Elliott Wave counting is always an exercise in probability.

Have a great weekend.
TraderJoe

Friday, April 6, 2018

Only Three Waves Up

Market Outlook: Now Getting Higher Volatility
Market Indexes: Major U.S. Equity Indexes closed lower
SPX Candle: Lower High, Lower Low, Lower Close - Trend Candle
FED Posture: Quantitative Tightening (QT)

The Eight Fold Path Method warned us yesterday to look for a down wave. See yesterday's chart to wave (4). The methodology was rigorously followed. Of course, the down movement started with the President's over night comments on a possible additional $100 billion in tariffs on China, and a -40 point drop in the ES futures.

When the cash market opened, the down wave eventually broke 38% of wave (3). That was a first warning. The EWO then exceeded -50% of the prior wave high, versus the usual expectation of +10% to -40%. That was the second warning. (It was excellent to have someone else in the chat room call that out). We then allowed down to the 50% x (3) level only, and we showed this chart.

S&P500 Cash Index - 15 Minutes - 50% x (3) Limit


At that point, we drew two fractal indicators on the chart. One in blue for an up fractal, and one in red for a down fractal. In order to assume an uptrend, we said that the up fractal had to break. It did not. The down fractal broke and we said "the best assumption is only three waves up". 

This is also per The Eight Fold Path Methodology. We had an up wave where (3) or (C) > 1.618 x (1) or (A). But, when the fourth wave didn't hold the EWO parameters, or the 50% x (3) measurement, then as always, it was clear "a count of 1,2,3 is the same as A,B,C until it is not."

This was then borne out by the fact that the cash market overlapped the X wave, and then formally invalidated an impulse up count by overlapping wave (1). So now this up wave must be labeled as an (A), (B), (C).

The market gathered speed to the downside after that, trading down to 2,586 before recovering to close at 2,604. To avoid any confusion, here is the re-labeled chart, below. Note how the EWO just "kept on going" after the -40% level of the prior wave was broken.

S&P500 Cash Index - Three Waves Up


Is it just more whippy behavior inside a triangle? We can see two ways to count within the triangle. We'll try to discuss those and look for a formal down count after the dust settles and see what looks best. For right now, you can see how well this methodology helps to prove when a suspected impulse is actually an impulse - or when it is clearly something else.

For now, have a very good start to your weekend!
TraderJoe

Thursday, April 5, 2018

Gap Up Day

Market Outlook: Now Getting Higher Volatility
Market Indexes: Major U.S. Equity Indexes closed higher
SPX Candle: Higher High, Higher Low, Higher Close - Trend Candle
FED Posture: Quantitative Tightening (QT)

Yesterday, we said because we had counted "five up" that further highs along with the obligatory backing and filling were possible. Today, we gapped up, and then backed-and-filled some. Overall, the S&P500 was up about 18 points.

Today, in something of a rare treat, I'm going to post the S&P500 cash index 15-minute chart that was developed in the live chat room, showing each wave position wave-for-wave. That chart is below. The intent in this chart is to see if The Eight Fold Path Method is followed for this time scale.

S&P500 Cash Index - 15 Minutes - The Eight Fold Path Method

So, beginning on the left, we have the bottoming process. There are a pretty clear five non-overlapping waves up to (1) which your mind can probably imagine as being 'roughly' in a channel. Then, there are three clear waves down that obviously leave that channel. I have labeled this wave w because the following wave up to x only has three clear waves. It just misses making a fifth wave up. And the down wave to (2) also has only three clear waves on the chart. So, that down wave to (2) is a y wave. The y label is not shown, but understood.

The shape of wave (2) will become important later. Note, the EWO does cross below zero on wave (2).

Then there are five waves up labeled as i, ii, iii, iv, v to wave (3). In this case it is (3) > 1.618 x (1), and it is very, very close to the 1.618 level. The gap is located in wave iii of (3), and the EWO is at maximum on wave iii. It diverges ever so slightly on wave v of (3) - as it should - following The Eight Fold Path Method.

Today in chat room we called for a wave that would alternate with wave (2). If wave (2) is the expanded FLAT wave, as shown, with the higher x wave, then wave (4) might be expected to be a regular flat (i.e. not a higher b wave), a zigzag, dzz, or triangle. As best we can tell, we got three waves down to an (a) wave. Then, we got three waves up to a (b) wave. And somehow - probably because the payroll report is tomorrow - the (b) wave did not go over the top, expressing some of the alternation we are looking for.

At present, the Elliott Wave Oscillator is red and declining. So, this suggest that a fourth wave can be in progress with the right hand channel line as a target.

IF price wishes to, it may make any of several waves for a fourth wave down to 38% or over to the lower channel line. Because one of those options is a barrier triangle therefore, the overnight must be watched carefully to see if the high is exceeded. If not, one of the other options may be in play, and the Payroll report will, of course, have it's say.

If an impulse wave forms upward, it may well be an a wave of the (d) leg of the triangle we showed yesterday for the daily ES futures.

In any event, you can see above what I see. No mystery, no drama, just a simple procedure for wave counting. And yes, most importantly, you can see the options for even this fourth wave, at this small degree of trend. That is why I coined the phrase, The Fourth Wave Conundrum, and I contend it occurs at every degree of trend. It is one of the factors that makes using Elliott Wave for trading more risky than many people think.

It is one of the many lessons I have learned over the years about counting Elliott Waves. And there are many, many more. But, for tonight, have a good start to your evening.

TraderJoe


Wednesday, April 4, 2018

Outside Day Up

Market Outlook: Now Getting Higher Volatility
Market Indexes: Major U.S. Equity Indexes closed higher
SPX Candle: Higher High, Lower Low, Higher Close - Outside Candle
FED Posture: Quantitative Tightening (QT)

By the narrowest of margins, the S&P500 Cash Index, and the ES E-Mini S&P 500 futures missed making a new low today, and instead turned higher and closed higher. That leaves the chart looking the following. 

ES E-Mini S&P500 Cash Index - Daily - Potential Triangle

The whippy action continues to feel like a triangle. The downward count from (b) remains bothersome, but price did what it did and closed a gap today. With the daily slow stochastic turning up, it would not be surprising to see price and the 18-day SMA try to come together (including the necessary backing-and-filling).

In the chat room today, we were able to count five waves up, but with no divergence on the EWO. So, it is likely there is more ahead - at some point in the future.

The DOW, of course, made a new low at (c). It might be possible to count the DJIA, then, as a double zigzag down from the high to (c). There is also a "trap" count that I will try to cover this weekend. It involves counting the DOW downward as 1-w-x-y-2. If the DOW can make no progress above the 62% Fibonacci retracement, then this count may apply to it.

Right now what we know is that the downward wave to (c) took more time than the downward wave to (a). This helps fulfill a triangle's expectations. And it is less evidence for the EWI style 1-2-i-ii downward count at this time because there should be acceleration in a third wave. It should not be slower!

Usually, the (a) wave in a contracting triangle is the most violent. So far, that would hold true. Yes, the price bias is still down as it is below the 18-day SMA, and, yet, price did rise. This is a clear example of what I indicated in my blog two days ago. Further, we know that if the low of an outside day up is exceeded lower in the next two days then, and only then, would it be considered a trap for the bulls. 

And while the swing line looks to be turning up, it is still negated by price being under the 18-day SMA. Today would also be an example of Ira's caution against selling short against a lower daily Bollinger Band with the daily slow stochastic in over-sold territory (this is not trading or investment advice; it is just an example of when one of Ira Epstein's cautions has come true).

Meanwhile, let's see how far up this wave gets, and stay clam, flexible, and patient. Fourth waves can be real teasers and very testy!. 

So have a good start to your evening.
TraderJoe

Downward Diagonal ?

Update: 09:22 ET - Before the Bell

Yesterday, I stated that the downward count remains "quite complex". I did that for reason. Few counting options were making sense on the S&P500 or the ES E-Mini S&P Futures.

This morning, thanks to the overnight lower start to the futures, and two wave measurements, the count may have cleared up considerably. The count below needs one more lower low - or a serious attempt at it - to complete a potential diagonal minute ((c)) wave lower.

ES E-Mini S&P500 Index - 4 Hr Futures - Potential Diagonal

The issue here is that I have been looking for a count that does not contain degree violations. The measurements that make this count possible are that within the first blue a, wave iii is longer than wave i, and wave iv does not overlap wave i, or encroach on wave ii price territory. Further, I was trying to apply what "looks like" obvious three-wave movements, and yet, get the "fives" correctly placed.

So, in this count, wave minuet (iv) would be shorter than minuet (ii), wave minuet (iii) would be shorter than minuet (i), wave minuet (iv) overlaps wave minuet (i), and, now, wave minuet (v) would be have to remain shorter than wave minuet (iii). Once again the Elliott wave process gives us a clear invalidation point!

If prices can make the lower low, and  then pop up higher out of the wedge, and, then successfully back-test the wedge, a higher wave overall might then occur.

But, note this: in a contracting ending diagonal, it is acceptable for price to fail to just make that lower low.

Let's see how it goes. Have a good morning.
TraderJoe


Tuesday, April 3, 2018

Hopping Around like an Easter Bunny

Market Outlook: Now Getting Higher Volatility
Market Indexes: Major U.S. Equity Indexes closed higher
SPX Candle: Lower High, Higher Low, Higher Close - Inside Candle
FED Posture: Quantitative Tightening (QT)

The Friday post indicated that the market could get scary to downside on Monday. It did. In fact, the Dow Jones Industrial Average eeked out a new lower low over that of February 9th. Neither of the S&P500, the $NYA, the ES futures, the NQ futures or the Russell 2000 Futures did.

Looking at today's daily ES E-Mini S&P500 Index futures, the following may be seen.

ES E-Mini S&P500 Index Futures - 90%

While the Dow actually made a marginal new low, the ES made the 90% level. That is a level at which we always recognize (at least) the phrase, "B wave of a FLAT, or next impulse (lower in this case)."

It becomes less likely that a triangle will form when the 90% level is breached. Just less likely - not impossible. We also see that yesterday's candle made a lower low on a divergence of the daily slow stochastic, and the daily slow stochastic climbed above the 20% level by the futures settlement, today - preventing embedding.

Further, the 18-day SMA crossed below the 100-day SMA in a bearish cross-over. This would not be the first time in a fourth wave the key moving averages crossed over. That happens quite regularly in fourth waves.

However, as long as price is below the 18-day SMA, the bias is down. The bias being down does not mean that price can't rise. It most certainly can if it wants to. The wave count on the down wave from the 13th of March remains quite complex.

The next key observation will be whether prices can make either a higher high day, or a lower low day. Today's inside day has the potential to help turn the daily swing line up, but that has not happened yet, and price would have to get over the the 18-day SMA to make that more meaningful.

Have a good start to your evening.
TraderJoe