So, let's talk only about "what we know", and "what we don't know", and let's see what the evidence tells us.
We know that the Dow Jones Industrial Average made a new low over it's February 9th low. That is no longer in keeping with the large daily contracting triangle. We also know that, at the same time that the Dow made it's new low, the S&P500 cash index reached the 90% level. That is often consistent with the formation of a FLAT, or the next impulse lower.
We also know for a fact that the S&P500 cash index fifteen minute chart (from Friday's blog post) made only three waves up following the rigorous approach of The Eight Fold Path Method from the April 2 low, to the April 5 high. We also know, using measurement, we can count the down waves from the March 13 high as a five-wave sequence without a degree violation. We showed that on the blog post of April 4th (morning).
Now, let's post an hourly chart of the cash S&P500 index and see what else we can tell for sure.
 |
| S&P500 Cash Index - Hourly |
First, I have labeled the three waves up referred to above from April 2 to April 5 as the small degree three-wave sequence, wave .a, .b. .c. in keeping with the chart we showed on Friday. For clarity on the charts the .c waves are not shown, they are understood.
That being the case, there are two other things we know. They are, first, that the wave sequence down from March 27th to April 2nd is also a three wave sequence - also labeled as .a, .b. .c. And, second, we know that the shorter up wave sequence from March 23rd to March 27th is also a three wave sequence. No matter how much one's eyes try to make that wave sequence a "five", we know that lower prices, not higher prices followed it. So, the best count is as of a "three". Further, shorter term examination of this wave will show it also does not follow The Eight Fold Path Methodology.
So, now that we have covered what we know, we can discuss what we don't know. First, it is possible to label the downward sequence as a minuet (a) wave of a zigzag that does not break the low. Then, it is possible to label the three-wave sequences either as a,b,c,d of a potential running triangle. Or they may be re-labeled as w-x-y of a double combination whose purpose was to take up time and move price sideways, where w = a, x = b, and y = c. So, it is entirely possible that a (b) wave ended at the location on the chart shown as c.
But, if the wave is a double combination, then the y wave was a failure wave. It did not cross above the a wave high.
Next, we do not know the d wave, downward, is completed. It might be, but it does not have to be. Still any three-wave up wave from here, whether in fact a second wave, or a potential e wave, will give the structure following the (a) wave, the "right look" for a running triangle. And, we can ask the question, "with all the bad news on Friday, including tariffs and poor job growth, why weren't the lows exceeded?" Could it be the market is waiting to properly form a triangle?
Remember, for a triangle to form properly, the potential e wave must end above the (a) wave low. So far, that is not a problem. And, from the standpoint of form and balance, it would be best if the e wave ended above the blue hourly EMA-34 shown on the chart. The latter condition is a nice-to-have, and not a requirement.
In either case, double combination or running triangle, it would likely mean that the early April low on the S&P500 will likely be exceeded lower.
And, if we get a second zigzag downward that marginally breaks the lows, we may be getting an contracting diagonal wave lower overall on the daily chart. Let me sketch out what that might look like.
 |
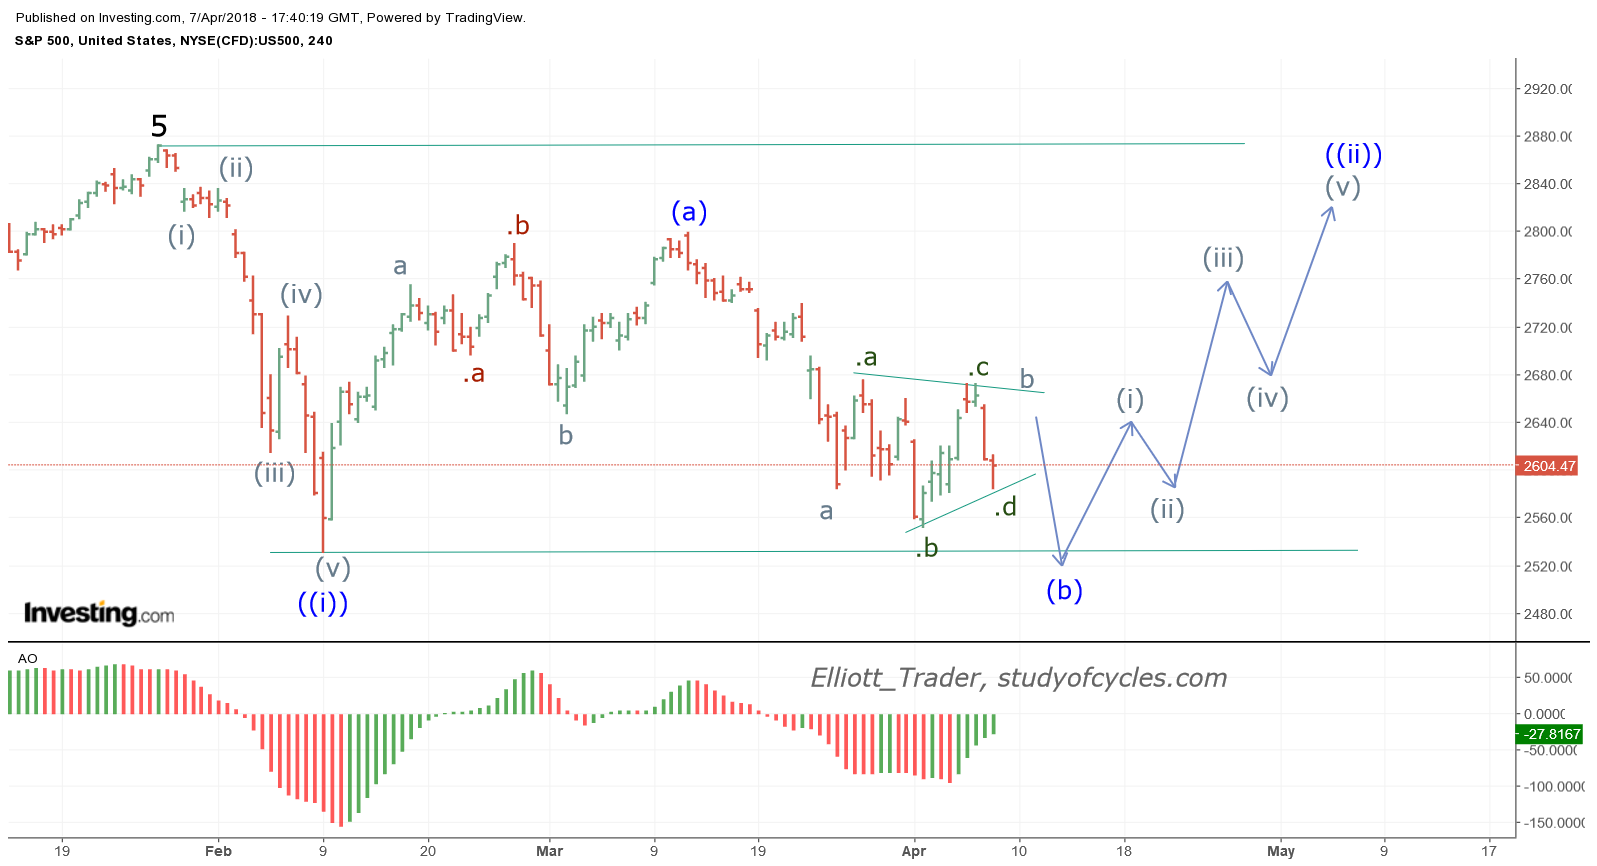
| S&P500 Cash Index - 4 Hr Chart - Potential Diagonal |
For this count, then minute waves ((iii)) and ((v)) must make required slight lower lows, yet remain shorter than wave minute ((i)), down. Further, minute waves ((iii)), ((iv)), and ((v)) must all form as the required zigzags.
And, I will also show the best alternate for this count, as below. It is the double zigzag.
 |
| S&P500 4-Hr Chart - Potential Double Zigzag |
So, let's look at these two alternates, and again, using what we know or can plainly see decide which of these two might have the better chance of occurring. Here are some additional things we know.
First, the second down leg to ((iii)) or ((y)) has taken more time than the down leg to ((w)). While not fatal for a contracting diagonal, usually, most often, contracting diagonals contract in time - as well as in points. In other words, ((w)) or ((i)) should have taken the most time. It hasn't.
Second, we can note the Elliott Wave Oscillator (EWO, or AO on Investing.com), and observe that is it presently diverging, and it might diverge further if a marginal new low is made. While that is a key signature of a contracting diagonal, then wave ((iv)) up, of the diagonal count would be required to have it's EWO or AO to be less than the peak of wave ((ii)) for the diagonal to agree with the momentum indicator. But, it is also possible the divergence sparks an impulse wave up, and that could mean Minor 4 ends at the low, and Minor 5 heads higher. That Minor wave 5 could be a gap filling wave, and so it's importance is not to be taken lightly.
Third, don't forget we know that potential Minor 3 is a 2.618 wave x Minor 1. And that is more evidence we must stir into the mix. And it favors the double zigzag count.
Finally, while we don't know for a sure if the smaller triangle is forming here, we must ask, "IF that triangle does form here, why would it be forming right here?" Triangles usually precede the last wave wave in a sequence. If so, that would mean a contracting diagonal lower could not form. If only that sideways double-combination forms, then a contracting diagonal could form.
So, while I apologize for presenting the case for which there is less evidence first, it is my clear intent to show you how knowing the different styles of Elliott Wave patterns, and how their alternates form from each other, can help you weigh the evidence for yourself. At this point, there is slightly more evidence for the second pattern than the first, but I would still rate them at 30:50%, and therefore I have literally no interest in which pattern forms. I just remain neutral and objective.
Now, the smart ones among you will shout, "wait, TraderJoe, your probability didn't add up to 100%!, so then aren't you saying it's possible an Expanding Diagonal is forming downward also?"
If you asked that question, then "bingo!". Give yourself the prize pot.
Yes, an expanding diagonal or even an expanding triple zigzag lower (its alternate) can form from this location. After all, it's middle leg would be longer in time as is usually seen in an Expanding Diagonal.
But, then, in that case wave ((iii)) or ((y)) must become longer in price than wave ((i)) or ((w)). And that has not been seen yet. And further, it's EWO would be lower than that of wave ((i)) - which it is simply not, at present. So, we give that a rating of 5%, and watch to see if it occurs.
What about that larger daily triangle? Still possible in indexes like the NQ or the RUT, but likely not in the Dow, because of the lower low. And getting exceptionally less likely in the S&P500 because of the 90% measurement, and because of the current wave structure. It is very hard to count a completed zigzag down from the March 9th high in the S&P500 cash index. Still, it is just barely possible if the down wave falls short of a new low it could form in this index, too. So, we will leave that probability at 10%, too. So, here's what we have.
Double zigzag - 50%
Contracting diagonal - 30%
Larger Daily Triangle - 10%
Expanding Diagonal - 5%
Please keep in mind that 10% probabilities do not rule out a pattern. Events with only a 10% chance happen all the time - like every time price closes outside of a Bollinger Band (which only has a 5% probability). All it takes these days is a properly placed news story or an ill-timed tweet, apparently.
Wait a minute! The devil, you say, there is still 5% left over? You Bet! What if wave ((i)), or ((w)), down, is actually a "five", and not a "three". Then, a similar wave structure in the second chart can be used to justify, ((i)), down, and a FLAT to a minute wave ((ii)), just with a five-wave sequence up that does not exceed the high. For clarity, let me again draw that pattern out.
 |
| S&P500 Cash - 4 Hr Chart - Flat Wave ((ii)) |
There are three likely problems with that count. The first is the 5 label at the left. Possible? Yes. But as to good form and balance in the weekly wave structure - a bit less likely because of that 3 = 2.618 x 1 measurement that we have talked about so often. The second one (which is less fatal for the count) would be that one or more of the gaps might likely not fill from wave ((i)) down. And it means they would not fill for years. And the third problem is that the whole up wave, wave ((ii)), would be taking an extraordinary amount of time in relationship to the first down wave ((i)). Again, this is certainly not impossible but looks very odd for a significant down move.
So, now the probability table looks like this:
Double zigzag - 50%
Contracting diagonal - 30%
Larger Daily Triangle - 10%
Expanding Diagonal - 5%
Flat wave minute ((ii)) - 5%
And now the probabilities add up to 100%.
Step by step the market will uncover its pattern. In the meantime, more volatility is expected - lately that volatility has been occurring in the form of internal flat waves. It makes wave counting almost a form of mental torture, right now. But, none-the-less, that is the task. Be patient, be flexible, be calm, and we'll get through this.
Remember, this is The Fourth Wave Conundrum that happens at every degree of trend. And it really reflects that, in every wave, at all times, Elliott Wave counting is always an exercise in probability.
Have a great weekend.
TraderJoe
Hi Joe,
ReplyDeleteSuper nice. You have wonderful weekend.
Thanks, you too.
DeleteYes. It can be confusing or daunting. Take it in small bites.
ReplyDeleteHi Joe, concerning the double zz can the y wave move lower, a Fibo relationship between w and y for example Cheers
ReplyDeleteHi Brian. Yes it can. Then that would rule out the triangle option in the SP500, too.
DeleteHi Joe,
ReplyDeleteIf I understand all 5 possible probabilities correctly:
1. Start from Monday, mkt should go up first and it should not go pass 2672
2. After 1. mkt shold go down, it may or may not break either Feb low 2533 or last Monday low 2553.
ET, from a longer term perspective, has the SPX gotten over to the lower trend channel on your weekly chart? Thank you for the valuable and useful insight!
ReplyDeleteHi John. Welcome. Yes. It is attacking the lower channel line.
DeleteWow ET! 1 question should the 13 week ema and 34 week ema cross? I've noticed that downward turn the 34 week ema has been taking.
ReplyDeleteYes, price is below the weekly EMA-34. And the EWO is still above zero on the weekly chart with 115 candles. This still qualifies as a weekly Minor 4, using The Eight Fold Path parameters, until it doesn't. That does not mean I'm bullish. It means I'm neutral and objective until the situation clears further.
DeleteThanks for sharing sir looksfishy
ReplyDelete