Tuesday, April 30, 2024

LH - LL - LC

I had mentioned in a previous post that the ES futures price could trade higher into Monday or Tuesday. They did. They made a higher high on Monday. And, when trading started for the Tuesday session, prices traded higher than the prior close. But they couldn't take out the previous session high, and collapsed on a turn-around Tuesday, closing lower than the three previous closes. Apparently, the higher employment cost index, the higher housing prices and the much lower Chicago PMI reading (37.9 vs prior 41.4) were too much for the market to absorb.

Today was, coincidentally, also the end of a calendar month. So, there may have been an element of the typical end-of-month "window-dressing" involved in the mix, as well.


So now, tomorrow is both the first of a new month (which often sees the typical inflows from company bonus plans, 401K's, dividend reinvestment schemes, etc.) and an FOMC announcement day with press conference following that. The FED could decide not to change the rate structure but might decide to tinker with the pace of the quantitative tightening - or not! 

So, there is some significant potential for price retracement, but there is no guarantee. Sometimes the investment committees decide to wait on the announcement results and make decisions the day following. Then, too, there are lots more economic reports yet again on Thursday & Friday.

So, a lot of things are possible tomorrow. A whippy session can not be ruled out. However, a suggestion would be to treat yesterday's high as a 'wave-counting-stop' until we know more. 

Keep in mind we still have the lower daily Bollinger Band and the 100-day SMA below the market. There is no change in wave count yet from the prior post, but since there isn't really a significant upward overlap, I also have to still reserve the right to call a new lower low - just five-waves-down in an impulse (rather than the bullish falling wedge). 

We'll see how it goes, and I can only say that one "old dog in the business" - Ira Epstein - tends not to like to trade through major reports. He has someone who agrees with him on that score - at least not until the results are known and the algo's have had their say for a while.

Have an excellent rest of the evening,

TraderJoe

Monday, April 29, 2024

Battle for the 18-day SMA

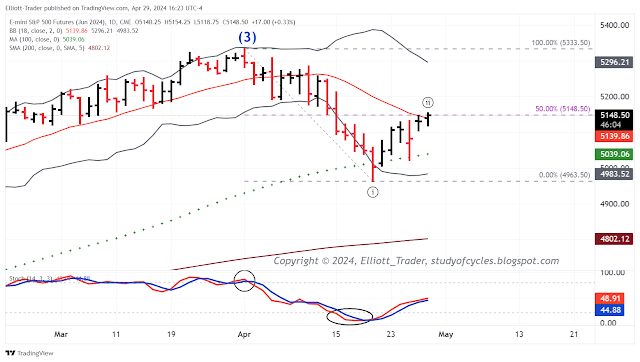
Based on the ES daily futures, prices spent the day waffling on both sides of the 18-day SMA, the "line in the sand", at about the 50% retrace level.


As of this writing the futures are not closed yet, but at the cash close they looked to finish above the mark. If so, that would flip the bias to positive for now. But the bars are currently "narrow-range-bars" and that raises some concern.

Another item of note is that the upper daily Bollinger Band is curling down under the prior all-time-high. In the middle of the price range extreme patience and flexibility are needed because the daily algo has the largest room to move and can generate whippy prices just for the pure frustration of it.

Have an excellent start to the evening,

TrasderJoe

Friday, April 26, 2024

BFW

The simplest way to count the hourly SPY chart is with a truncation (*) wave up just short of the former all-time-high, followed by a Bullish Falling Wedge (BFW) lower, followed by a channel count upward in the following manner.


The upward (c) wave does not have to be done, yet. It might spill over into Monday/Tuesday to try to reach 62% or greater. But, at present, it is in excess of a 50% retrace on the downward wave which is acceptable. 

First waves down tend to be real stinkers, but the alternation in this one is a long and deep wave (ii) flat, alternating with a short and shallow wave (iv) zigzag.

If the up count since the low is going to bear-flag, it should end in this area or else it would have to form a double-zigzag or a Flat to take more time. Overall, I am still looking for five, clear minute-degree waves down to make the Minor A wave.

In any event, have a good start to the evening and the weekend.

TraderJoe

Thursday, April 25, 2024

Outside Day Up

Just a chart today with the wave label degrees continued from yesterday. We don't know wave v is over yet and it could become longer than iii.


Wave v can still be whippy, so care, caution and flexibility still needed. The outside day up is valid unless the low is exceeded in the next two trading sessions.

Have an excellent start to the evening,

TraderJoe

Tuesday, April 23, 2024

Baked ?

For the last several posts I cited a likely downward mess - which we were treated to. I said there was a good possibility of making a diagonal. I think we did. As the chart below shows, there is a way to count a 5-3-5-3-5 expanding diagonal in the ES 4-Hr futures - done and complete.


This count would have the form (v) > (iii) > (i), and (iv) > (ii) with wave (iv) overlapping wave (i) and not traveling beyond the end of (ii). The main reasons for the count are the size of wave (v), and the precision by which wave (iv) was longer than (ii) but did not exceed it.

I have dropped the degree one degree for the time being and see the whole wave structure as a minute  wave. Alternatively, the whole structure is the Minor A wave, also done and complete - depending on which degree it turns out to be. The downward sequences are "5"'s and not "3"'s, and the upward minuet numbered structures, the parenthesis ( ) structures, are zigzags as they are required to be. Wave ii is a flat - which is acceptable in the impulse portion. The only element which raises question on the count is that (iii) is shorter in time than (i), while it is longer in price. But then, (v) is much longer in time again which seems a reasonable trade-off.

The trend lines are nearly perfect, and when I look at the whole structure on the daily chart, it just looks a little small to be the whole Minor A wave. I could be wrong about that. But no one knows what is coming tomorrow - not me, not you - so we'll see how the waves do.

There is nothing that forces the adoption of this count yet. There is still a way to consider a truncation high and wave (iii) at the bottom, but there isn't a great Fibonacci ratio in that count either. So, this fits best at the time, though I do reserve the option to see if it impulses by making a new divergent low first.

Have an excellent start to the evening,

TraderJoe

Sunday, April 21, 2024

Big Picture Reminder

The ES 2-weekly chart is below with a reminder of what can be the big picture: we may be forming a 3-3-3-3-3 Contracting Ending Diagonal at Primary Degree.

ES Futures - 2 WK Close - Potential Contracting Diagonal at Primary Degree


Note that with 106 2-weekly candles on this chart, the Elliott Wave Oscillator diverges where it should. It is often the case that wave (4) will try to come down to undercut the rising trend line to set traders in the wrong direction before the turn for Intermediate (5), higher. In the process the EWO might come back down to the region of +10% to -40% of wave (3).

This count sets a specific invalidation in that price should not go over the current all time high before overlap with wave Intermediate (1) occurs. The overlap is expected in this case. Further, the lengths of the wave structure should be (5) < (3) < (1), (4) < (2) with (4) overlapping (1) without traveling below the low of wave (2).

Why? Because often a diagonal pattern signals that a market that has gone too far, too fast, and is near the end of a longer-term wave. And Primary  - if it forms properly - would be the end of a Cycle V wave.

Have an excellent rest of the weekend,

TraderJoe


Friday, April 19, 2024

Into the Real Mess - 7

In keeping with the theme of this wave being a real mess, I felt the best way to deal with it going into the weekend was to greatly oversimplify the count as the wave internals can be counted numerous ways.

ES Futures - Daily Close - 'Possible' Parallel

Bottom line: we are looking for the Minor A wave down, composed of five minute-degree waves. But, as this point - whether an impulse count or a diagonal count, there is insufficient retrace in the ES futures to allow us to place a fourth wave at this time. We do not 'know' the third minute wave is over, so it could go lower.

The ES price got down below the lower daily Bollinger Band and pierced the 100-day SMA in the overnight news regarding Israel's actions. Then, during the cash session today, price weaved around on both sides of that average, closing just slightly below it, and below the lower daily Bollinger Band for the sixth consecutive day.

We note that with 14-daily candles the RSI is not solidly in over-sold territory yet. "A" waves can be pretty atrocious so caution and flexibility are warranted until there are some clearer wave patterns and retraces.

Have an excellent rest of the evening and start of the weekend.

TraderJoe


Thursday, April 18, 2024

Into the Real Mess - 6

Today marks the 5th consecutive day that the ES June futures have closed below the lower daily Bollinger Band as per the chart below. The close today was 5,049.00 compared to the lower band at 5,050.67 and this drops the odds to 1-to-3 percent that the next close will be below the band. In Ira's public videos he claims the most he has ever seen is seven-in-a-row.


However, of interest, the ordinary calculation of the daily slow stochastic has now attained embedded status on the downside.

Also of note, in any one of a couple of fashions, there are enough waves down to claim the Minor A wave has been made. And, yes, price could still attain the 100-day SMA and not ruin the count.

Another item is for certain. This decline since 01 April is already longer in price & time than the December 2023/January 2024 decline, and therefore it is of a higher degree. Remember we labeled that decline as minute ⓑ, and so labeling this decline as Minor A agrees that this degree label is larger than that one.

One also notes that the 18-day SMA is pointed downward and will likely act as resistance on the way up. With the embedded status, it is possible that Smart Money will continue to sell rallies until the embedded status is lost (and the %K red line of the daily slow stochastic crosses back up over the 21 level).

As we stated in the comments for the prior post, it is possible we completed the Minor A wave and are now into a messy B wave as a flat or combination. We'll see how tomorrow proceeds.

Have an excellent rest of the evening,

TraderJoe

Wednesday, April 17, 2024

Into the Real Mess - 5

We were expecting a messy wave downward. We're getting one. So far, in the ES futures, we may be getting a diagonal - as previously expressed. By far, the count that 1) is most proportional, 2) flows the best, and 3) does not involve degree violations is this expanding diagonal which a couple of us are counting. As well, this count follows the Elliott Wave Oscillator profile at the moment and can be clearly seen in the closing only chart below.


There are other ways to see the Minor A wave at today's low, but it does not quite look as proportional as this count. So, I'll hang on to that alternate for the time-being.

The above chart does provide a clean invalidation and it also suggests quite a wild snap-back from the current price lows. That is in agreement with today being the fourth consecutive close of price below the lower daily Bollinger Band, and the daily slow stochastic still in over-sold territory. And A waves can often be diagonals, particularly in corrections. So, we have to go with what looks best at present.

We'll keep you updated as best we can. The wave structures are very testy.

Have an excellent start to the evening,

TraderJoe

Tuesday, April 16, 2024

Into the Real Mess - 4

Just a word of caution for tomorrow. Today marked the third consecutive day of the ES futures closing below the lower daily Bollinger Band with the daily slow stochastic in over-sold territory as per the ES daily chart, below.


This means the odds of another close below the band is only about 2 - 5%. Some of the Smart Money is likely taking profits at the lower band. Yes, price could go down to fill the gap or hit the 100-day SMA. But, even as today showed (because of the profit-taking) whippy behavior could immediately follow. Price could certainly close back inside the band at any time.

From an Elliott-Wave perspective we are counting the Minor A wave down. We can see one way it could have completed, and another way for it to continue. See the comments from the prior post if you have the interest. So, we are patient until the length of price movement becomes more convincing.

Have an excellent start to the evening.

TraderJoe

Monday, April 15, 2024

Into the Real Mess - 3

A lot of people are expecting a wave three to "cut-loose" to the downside now (when some - not necessarily the same ones - were screaming for higher prices before). On the way up. I just urged caution, patience and flexibility, and on the way down - the same. Today ES futures prices DID complete the contracting diagonal from yesterday, and - so far - prices have not invalidated either lower or higher. So, let's give some credit where it was due. We saw whippy behavior, called it, and got it.

But what IF prices do cut loose tomorrow - say with an overnight gap and follow-through lower. This could happen. I am agnostic. But how would one count it? I can see two ways - which still makes this down wave part of the real mess.  Here is the first way: The Truncated Top.


In cash SPY, a contracting diagonal count does not work as well as it does in futures. This suggests the above option of a truncated top, followed by a minute-degree wave , lower. Elliott himself, Prechter following him, and Neely following him all suggested major turns might see a truncation at the top. Then, following minute , there would be a minuet (w), (x) and (y) wave up to the second minute wave, circle-ii, where minuet (y) is a failure wave. It is very important to pay attention to degree labels here, and not think every down wave is a "1" wave when it goes nowhere. 

The problem with the above scenario is that minuet (x) and minuet (i) - which are supposed to be smaller degree waves than minute  are actually longer in time than minute  is with the truncated top. This is not supposed to happen. This is why degree labels are important.

So, if this solution doesn't work, is there one that does? Well, first keep in mind we do have the valid contracting diagonal in the ES futures still on the table, which meets all guidelines in both price & time. And we simply do not know what the overnight and morning will bring yet. But here I think is the better alternate for cash.


As several of us discussed earlier, it is possible to get an expanding diagonal where wave minute-iii, circle-iii, is not completed yet. Notice the following attributes of this count:

  1. The prior wave ends at the prior all-time high, where Minor C, and Intermediate (3) is shown. Then there are "three-wave" sequences downward as zigzags.
  2. Following minute , down, the minuet (a) wave diagonal, down, would be shorter in price & time than all of the minute  wave. Minuet (a) is supposed to be a smaller degree wave than minute , and here it is in both price and time.
  3. Next, notice the minuet (b) wave up. It is shorter than all of minute-ii, circle-ii in price and time. Fantastic, it follows degree definitions, too!
  4. Then, notice sub-minuette i, down. It is shown looking slightly longer than (a), down, right? But that would violate degree label definitions, wouldn't it? YES! That's because the i portion of that wave actually ended at 512.00, and everything else after it in the correction is an expanded flat for sub-minuette ii! So, then degree definitions are not violated.
  5. And so-on goes the minute-iii, circle-iii, wave until it maybe reaches the 1.618 Fibonacci extension - the level of which is shown on the chart.
Folks I simply can not do this every night, wave after wave, adjusting charts which do not consider wave degrees and Fibonacci ratios, so I simply will not. There are too many errors that others can make for me to suggest fixes. I have clearly outlined the problems with degree labeling that most ignore. (Refer to Neely interview if you haven't already at this LINK: Avoid the Top Five Mistakes Counting Elliott Waves.)

I am looking for people who put as much thought into a chart as went into the one above.  Notice "one thing" about the chart immediately above: it gives a clear & specific invalidation level to the count. If your charts do not do that because you don't consider Fibonacci levels or degree definitions then it could seriously hurt your trading also: because a bad wave-count can lead to a bad trade. And the second chart is just an alternate, too. It does not have to be the real deal. But it uses sound rationale and follows the rules, guidelines & degree definitions. So, if it busts it would likely not be because of something we did, but more likely because the Smart Money saw something we did not have access to.

Anyway, have an excellent rest of the evening,
TraderJoe

Saturday, April 13, 2024

Into the Real Mess - 2

Due to overlaps, we have been suggesting that the wave down off the recent all-time high might be in the form of a diagonal in the ES futures. We showed one view of an expanding diagonal but the criticism of it (rightly so) is that the third wave would be shorter in time than the first - which runs afoul of a guideline for an expanding diagonal but not a rule. So, for the sake of following the rules and guidelines in the best spirit possible, a couple of us also suggested the contracting variety of diagonal, as below, on the ES 4-hour chart.


In this case - as the Fibonacci ruler on the left shows - wave (iii) would be less in price that wave (i). It is also less in time which follows the guideline for contracting diagonal. 

Now the question is whether there will be another whippy zigzag wave (iv) that is less in price than wave (ii). That means wave (iv) has 5,249 as a practical maximum before invalidating. Again, wave (iv) must be in the zigzag class of waves and may not be a flat for a diagonal to form properly. If wave (iv) remains valid in price, then the next question would be does it follow the contracting diagonal guideline for being shorter in time, too? If it does, then it is on to wave (v) which must be shorter in price than wave (iii) and might be shorter in time than wave (iii), too.

Again, the personality of the diagonal is that the bull forces are not convinced that the prior rally is done yet, and they are committing large amounts of capital but with the effect of not making higher highs. The swing-line trend is lower highs and lower lows, and the bias is lower as long as price remains below the 18-day SMA.

Again, the five minuet down waves (i) to (v) likely compose the minute  wave of the Minor A wave of the decline within Intermediate wave (4), if the waves finish properly.

Have an excellent rest of the weekend.

TraderJoe

Tuesday, April 9, 2024

Into the Real Mess

With the prior post (Get Ready for a Real Mess at this LINK) I have tried everything possible to prepare you for the current whippy market behavior. I have written before about The Fourth Wave Conundrum that this is the time when "everyone wants to know what the count is because they are likely getting whipped badly". I have also tried to teach readers about diagonal structure. So, let me preface that I do not know if the count below is correct. But I do know that the count provides a precise invalidation point. This is the chart of the ES 4-Hr futures.


The count would be of the 5-3-5-3-5 Diagonal. It is a speculative count. But the count was taken because wave (iii) is longer than wave (i) in price, and wave (iv) is longer in price and time than wave (ii). This means a wave (v) should become longer than wave (iii).

Notice than within wave (ii), wave 'a' is also an expanding diagonal. And now, in wave (iv), we may have a zigzag within a channel shown (dotted parallel). If that price pattern holds, then it is possible that the fifth wave will form properly.

But the second reason the count is taken is that it allows us to drop the previously listed "wave-counting-stop" from the prior all-time high to the new location shown. This is the only precise wave-counting-stop I see because wave (iv) is not allowed over the high of wave (ii).

The diagonal personality is that the bullish market participants are simply not convinced the game is up, and they are fighting back tooth-and-nail. Hence, the "battle at the 18-day SMA", the "line in the sand".

I cautioned against getting gung-ho on this wave. I'm sure some are listening, but not all. The whipping is brutal. But, if a minute  wave does form properly, then if a retrace holds below the high, perhaps five minute-degree waves will form to make the Minor A wave down. It could take a while, and some might not have the patience for it.

I encourage you to take this time to learn the wave principle in full detail, rather than go on YouTube and learn it incorrectly, or ask people to tell you what their counts are. You simply will not learn until you struggle yourself with counts on markets which I do not show. But, if you do, then - after a while - the light bulb might just come on.

Again, nothing says the above count will come to pass. But it's the best I can do in my struggle to understand the current market.

Have an excellent start to your evening,

TraderJoe

Monday, April 8, 2024

Battle at the 18-day SMA

In line with our theme for this wave of getting ready for a real mess, ES price action today was eclipsed by, well, The Eclipse. For those who could see totality, it was spectacular and looked like the "real deal". For those who couldn't, they will have to wonder for another twenty years to get the chance to satisfy their curiosity (2044). For those who watched price action, it was whippy, back-and-forth algo trade on both sides of the 18-day moving average, the "line in the sand", as the daily chart of the ES futures shows, below.


Another way to describe price action today, however, is that it was the second inside day following the double-close key reversal two days ago. By not closing above the high of that bar today, a continuation lower at least has even odds - a trap for the bears was not sprung today, but there is no guarantee.

Price still has not touched the lower daily band and over the last two days gave the impression of coiling and coiling and coiling. So, a breakout in either direction might last a bit. Until we see such, it is likely to be sloppy - even though downside counts remain possible.

Have a good start to the evening,

TraderJoe

Saturday, April 6, 2024

Get Ready for a Real Mess

Based on the count in the DJIA cash (and near contract futures), the count to the Minor C wave and the Intermediate (3) wave is likely over. The minute second wave trend line, from the extended first wave, was broken and resulted in a shorter third wave, triangle fourth wave and even shorter follow-through fifth wave, as per the daily chart of the futures, below.


But as simple as the next down wave might seem, it could be a real mess - especially to trade. Remember, if we are making a Primary  contracting ending diagonal, then Intermediate (4) must turn out to be an Intermediate degree zigzag, lower. That means that Minor wave C would likely end lower than Minor wave A. And fourth waves of any type can be difficult at the very least. But the chart below expresses just some of the many complications that can occur in this wave. So, let's get into it.


Starting on the left, the Minor A wave down - which must occur in five waves - can either be a rather standard impulse in total - or it can be a leading diagonal in total, either contracting or expanding. But worse, being a Minor A wave, it could start with a minute ⓘ wave as a diagonal, and then convert to an impulse for the second, third, fourth and fifth waves of Minor A.  So far, in the ES, the pattern is very overlapping and might be a diagonal wave, possibly expanding, but this could still only be the minute ⓘ wave of Minor A

If that isn't messy enough for the Minor A wave, it could be the Minor B wave that really throws some twists and turns into the picture because a B wave can be "any three". To make the point more graphically we have shown many of the 'most common' variations of the B wave, above. For example, in the upper left pane, the B wave could be a zigzag or a multiple zigzag. Even if it is a simple zigzag, either of its motive waves - but not both - could be an impulse or diagonal. But there is no reason the zigzag couldn't double or triple, as well.

Next, in the upper right panel the Minor B wave could also be a Flat. This is the most difficult start-stop pattern as it will throw off numerous traps. Yet, further, the Flat family can include double-combination waves, and/or less-commonly triple combos.

Third, the lower left panel shows one variation of contracting triangle, the "running triangle". But the wave could also drive one crazy as either a regular or barrier triangle, as well. Each would be a contracting triangle, and the barrier version might also be confused with a Flat wave - as above.

Fourth, in the lower right panel we show the possibility for the expanding triangle, as well, though this is less common.

Fibonacci Fifth, one must keep in the mind the possibility that the Minor C wave could be an impulse or diagonal as well - to alternate with the form of the Minor A wave - and that either the last leg in such a diagonal might truncate slightly or that all of the Minor C wave truncates ever so slightly.

In sum, this wave could be a feast for the algos. So, if you are personally getting excited about huge, and large waves down, my recommendation is do not get overly worked up. As you saw on Friday, retraces can be very, very deep, and difficult to call. And the down waves can be halting start-stop affairs which test the patience in the first place.

Remember, in the contracting diagonal Primary count, all that is required to happen is that the 4800 level, the high of Intermediate wave (1) needs to be overlapped in zigzag form. That is just not all that far, lower. And, yes, price can go considerably further down, but one needs to be aware of how compressed the pattern 'could' turn out to be.

Now, if you are looking for broad, swift and dynamic waves lower, then you are looking for the likelihood that this Intermediate wave (3) is actually Intermediate wave (B), up, and an Intermediate wave (C) down is to follow. That is possible as the alternate. I am taking the most conservative route here in a correction. But there is absolutely no sign of such a dynamic wave down based on the start of this wave down in the ES. One might argue that the Dow is falling faster. So be it. Still, the only sure way to call the difference will be if the Intermediate (4) wave invalidates at some point. We are nowhere close to that, yet.

Wave-counters should place a "wave-counting-stop" at the prior all time high as this would indicate problems with the diagonal count. We will lower this stop periodically while counting the Intermediate (4) wave, lower. And, when the Minor A wave is done, we may have to raise such a stop in order to allow for deeply retracing Minor B waves. They could easily go to 78 - 80% of Minor A.

It is my hope this post calms you down by showing you the complexities that can be faced. If you are calm by nature and treat trading more like just a fun business, you have more of the right attitude for success. For newer traders, this wave might provide really good opportunities to forego pressing the buy or sell button and learn the intricacies of counting waves instead - while the algos drive others crazy. Or turn to other assets to trade temporarily, if this fits your situation.

Have an excellent rest of the weekend,

TraderJoe


Thursday, April 4, 2024

Double-Close Key Reversal and More

ES prices traded higher overnight, then - depending on the index (like the DJIA) - they either immediately reversed from the open, or in the case of SPY / ES, made one more new high before reversing. Based on ES futures, prices then traded down through the prior two day's closes and look to close lower as of the cash close. The reversal, closing below two prior daily closes is known as a "double-close key reversal". Sounds ominous. The ES daily chart is below.


The market (likely) was emptying out in front of the Payroll Report tomorrow where some additional volatility could occur.

The other item of note is that the "swing line" indicator signaled a down trend the way that Ira Epstein recommends this indicator be used. To do this, there must be a lower low below a lower high, but - in addition - there must be a close below the 18-day SMA. Assuming the futures market closes somewhere in this area that will likely happen as well.

If so, then the daily bias switches to "lower" for the first time in a very long time. I personally would like to see a tag of the lower daily Bollinger Band, and the undercut of the 5,167 level so as to trade below the low of the fourth wave triangle we counted out in real time. That would increase the confidence that the minute ⓒ wave of the Minor Y wave of the Intermediate wave (3) is completed.

Have an excellent start to the evening,

TraderJoe

Monday, April 1, 2024

ES Local Count

See ES 1 Hr chart below. Futures were much higher overnight on the "first-of-the-month money". But none of this shows up in the cash market.


With the MACD on a peak, and cash not open, it is wise to see what cash does before drawing a conclusion.

Have a good start to the day.

TraderJoe