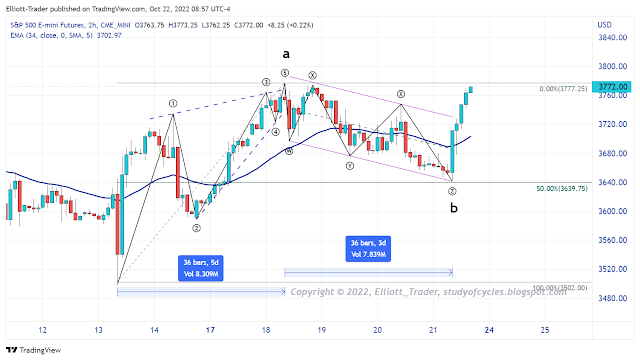
As most of you know, I follow the ES futures rigorously - while some Elliott analysts only study cash, and in fact some Elliott analysts (Neely, specifically) have stated at one time or another "not" to follow futures due to erroneous charting results resulting from time premium decay or other phenomenon. We have showed the SPY cash chart at this LINK from the comments of the prior post. But, if we ignore the cash market for a moment, you can see that consideration of the futures shows a Fibonacci relationship in time as follows on the ES 2-Hr chart, below, where the time of b = time of a.
 |
| ES Futures - 2 Hr - Equality in Time |
Also considered in this manner, the downward wave b is an exact 50% Fibonacci retrace from the high labeled as the a wave. The b wave also counts very well as just a triple-zigzag correction in a channel as corrective waves often form.
Further, when considered in this fashion, there are no degree violations in this count because although wave ((3)), up, is slightly longer in time than wave ((1)) up, it is a wave of the same degree, and its sub-waves are all smaller than the totality of wave ((1)).
There is by no-means (even with these relationships) an all-encompassing reason to lock-in on this count. IF an a-b-c results, it could just be the start of a double zigzag larger minute ((b)) wave, up. It is also possible that the count could be a/i and b/ii. Why is the chart not labeled this way? Well, it is very, very difficult to count cash in an impulsive fashion at the moment. And as of yet there is no evidence of a 1.618 wave upward. If a 1.618 wave results, we will gladly consider the second form of labeling. But not until then.
Further, if only three waves up results, we must then consider a return-trip to the lows to form a possible Flat minute ((b)) wave, up.
In case it is not clear, the primary message of this post is to 1) stay flexible, 2) consider all the options, and 3) consider the current locations of the upper and lower daily Bollinger Bands, particularly when those bands are traveling sideways. I know how all-too-easy it is to get stunned by an intraday reversal. And I know how all-too-easy it is to go ga-ga over momentum in one direction or another. These two emotions are to be avoided at all costs. If you can't curtail these emotions, and some others, then financial markets might not be for you. This is one of the reasons why we posted a wave-counting-stop at 10:19 yesterday in the comments. It is usually a place where trend-line analysis and channel analysis indicate that something is changing. The analyst's job is to find out what. And it is the trader's first job to protect one's account capital, rather than to chase after profit at every moment.
Have an excellent start to the weekend.
TraderJoe
Nice work. Do you have any thoughts on TLT? It looks like the yield on the 10y is going to hit that fib target of 4.43% that I have been expecting very soon. The futures market is now predicting a terminal fed funds rate around 5%. Thanks
ReplyDeleteI have already responded to this question several weeks ago, "because Elliott waves tend to travel in parallels, it would not be unexpected to see a rate on the US 10-yr of 6%."
Deletehttps://www.tradingview.com/x/83GiiRvk/
Pull-backs can come at any time.
TJ
👍 thank you
DeleteYes, you correct stock and commodity 'prices' for the inflation-rate by using a log-chart over the long term. But the 10-Yr 'yield' is the very definition of the inflation 'rate'. That is a 4.0% 10-yr yield means you expect inflation to be 4.0% (avg) for each year of the next 10 years. That is why you demand 4% interest at a minimum to compensate for the loss of the note's price. So, while you correct prices for inflation, you don't correct inflation for inflation by using a log chart of rates.
DeleteTJ
Thanks for the reply. I never thought of it that way before and it makes sense.
DeleteExcellent analysis TJ, thank you for the update. It would be nice to see a retracement to that 18 period m.a. if the market were to decide to continue moving higher.
ReplyDeleteLooks like the idea i posted 1:44 Friday. Glad we agree
ReplyDeleteAlthough I thought it was running flat, was unsure of violations
DeleteA new post is started for the next day.
ReplyDeleteTJ