Overnight the futures made a slight higher high, in more overlapping waves. Then, in back-and-forth overlapping waves, the futures made a pattern which initially suggested a potential triangle. But our commentary was, "possible triangle or (it might devolve into a..) Flat wave". The triangle possibility hung on most of the day, but eventually, the overnight low was exceeded invalidating the triangle, and a larger downward wave broke several fractals lower. Here is the ES 4-hour chart.
By considering the possible triangle, we did everything we we could to count upwards with the larger trend. Today, the market would not let us, but we had a back-up plan as per the comments.
So, there are still three-waves-down and three-waves-up. Towards the end of the day, price pierced the lower parallel trend line of the recent up channel as it contacted the EMA-34 on this time frame. The EMA-13 is also sketched in for reference. If the EMA-13 should cross below the EMA-34 on this time frame, that would be a considerable negative sign. Right now, we are nowhere near there, so this serves as information only.
On the four-hour time-frame a triangle is still possible, but sentiment remains extremely stretched and there will not be a resumption of an upward count unless price closes above the EMA-13 again. Similarly, price needs to exceed the ((C)) wave low to start a larger diagonal or other wave downward.
In case you did not see this news story from the comments, it is included here again. This new rule might really throw a money-wrench into bank procedures. And anything that bothers the banks can adversely affect markets (here is the LINK to the story).
"The Office of the Comptroller of the Currency finalized a rule on Thursday that Wall Street’s largest banks have strongly opposed since its proposal in November. The OCC’s Fair Access to Financial Services rule was finalized a day after current OCC head Brian Brooks announced his resignation. The rule seeks to require banks to provide quantitative metrics proving the risks that lead them to deny services to potential clients."
Have an excellent start to the evening.
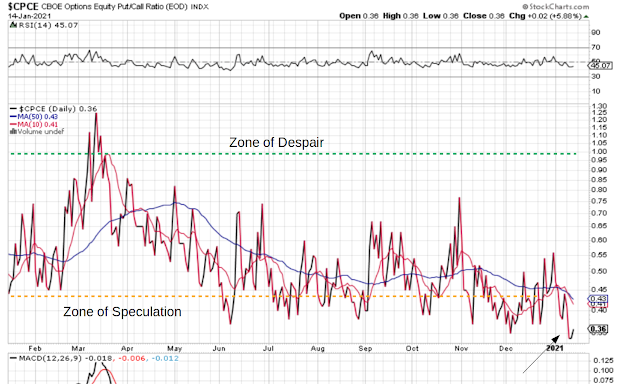
I added the current chart of the put-call ratio when the figures became available after the close.
 |
| Put-Call Ratio - Daily - New recent lows |
Even after today's downward movement, the put-call ratio barely budged.
TraderJoe

The put-call ratio chart was added after the close.
ReplyDelete👍
ReplyDeleteThanks!
ReplyDeleteA few observations on cash hrly -
https://funkyimg.com/i/3a4y5.png
To clarify, I mentioned several times on HDs reaching the peak RSI reading [this refers to the price close(s) at the peak RSI reading(s)].
Delete👍
DeleteWith about a half hour til opening, here's an update to TJ's 4hr above (per RSI) -
ReplyDelete(this ties in with hrly cash chart above)
https://funkyimg.com/i/3a5hE.png
ES 30-min: futures have a new low below the prior wave ((C)); cash does not, yet. Daily Pivot Points have been updated on the intraday wave counting screen.
ReplyDeletehttps://invst.ly/th3tq
Dow and ES futures flirting with losing the 80% slow stochastic level on the daily charts.
TJ
Very peculiar price action in VIX. instead of a capitulation spike signaling possible market low, we have a gap down, something I have never seen. Either a spectacular rally ahead, or someone's way out over their skis. What happens to gap should be informative imo.
ReplyDeleteNot seeing that on Tradingview VIX. Odd.
DeleteES daily .. now down to 18-day SMA, "the line in the sand". Daily slow stochastic now at 69ish. Given the length of the down move - being greater than the first (a), (b), (c) down; it looks like an expanding diagonal might play out.
ReplyDeleteTJ
Update to Dec post on VIX daily -
ReplyDeletehttps://funkyimg.com/i/3a5oM.png
I want to see the down TL. Taken out and then gap probably gets filled. All gaps in Vix get filled eventually.
DeleteFive up off the lows. If we are done I expect we see an abc down followed by gap closure and back to test or reclaim overhead round numbers.
ReplyDeleteWould it be correct to conclude that the time and displacement of the upward move qualifies it as being the same degree as the move down?
ReplyDeleteFB (if it can hold the 200 day Moving Average where it now sits) is the best looking of the FAANGS.
ReplyDeleteTSLA will add to the problem for the bulls when (if?) it trades below the 803.88 low put in on 1/11.
Aapl under it's 18ma and t-line, looking very weak. If last Fridays euphoric high in the markets on horrible news wasn't the top, I'll be very surprised.
ReplyDeleteMe too RM.
DeleteOne thing IS different this time as opined by Jeremy Grantham recently. This market is unlike every great bubble before, when bubbles were accompanied by an economy that was doing very well, near perfect. Today the market is much higher than it was last fall when the economy looked fine and unemployment was at a historic low. Now the market is near the top few percent and the economy is in the worst few percent which is without precedent. This may be a measure of speculative intensity itself.
I forgot to mention the dollar breaking out against all expectations (and many large short positions)
Delete