Yesterday, we said a higher high was possible, and if it occurred, it would likely start a diagonal sequence. The higher high occurred, and during the day, we showed portions of this chart which was not confirmed complete at the time (see this LINK) but which was showing significant divergence on the hourly MACD oscillator. A potentially completed ending contracting diagonal is shown below on the same ES hourly chart.
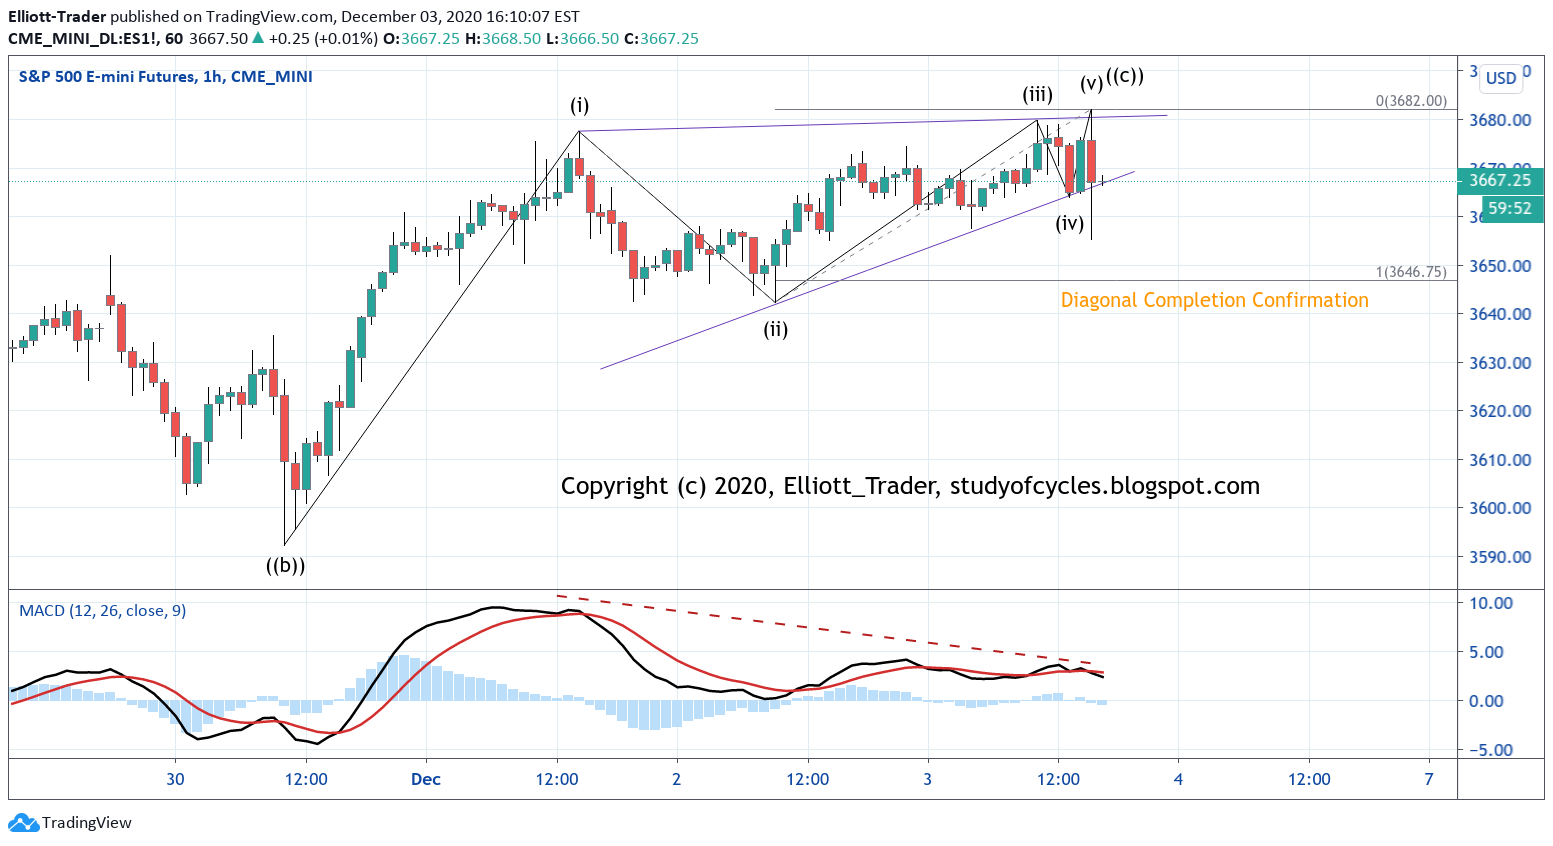 |
| ES Futures - 1 Hr - Potential Diagonal |
Such a diagonal might end the minute ((c)) wave upward on the ES 4-Hr chart, as discussed in previous posts (see the first chart in the post at THIS link).
Still, while the downward wave at the end of the session tended to act like exiting from a diagonal, a contracting diagonal can not be confirmed as completed until the length of wave (ii) is exceeded. That would occur below 3,646.75, and that is because wave (iv) in a contracting diagonal by the rules can not be longer than wave (ii) of the same diagonal. P.S. If the diagonal does go slightly higher, all it does is raise this number by the same amount it goes higher.
After the down wave occurred a nice 62% retrace occurred, then a slight lower low which might be the b wave of a Flat for wave ii - to take more time than wave i, down. So, we'll watch the overnight and see how it goes. A substantial gap lower in the overnight might be indicative.
So it is clearly stated, the alternate for this count is that wave (iii) of the diagonal ended at today's high, and wave (iv) ended at the 3,655 late-afternoon low.
Have a good start to your evening,
P.S. Below is the put/call ratio chart, showing a new low both for the raw index and for the 10-day MA
 |
| Put/Call Ratio - Daily - New Lows |
Note where the black arrow is at a new low.
TraderJoe
.
Thanks TJ
ReplyDeleteWelcome Tim.
DeleteAdded note: CPCE Chart is at the lowest I have seen in a while (most likely ever) .35
ReplyDeleteI added this chart as a P.S. in this post. Interestingly, the guidance in Barron's magazine says,
Delete"Readings in the CBOE equity put-call ratio of 60:100
and in the S&P 100 of 125:100 are considered bullish,
for instance. Bearish signals flash when the equity
put-call level reaches the vicinity of 30:100 and the
index ratio hits 75:100."
So, for the $CPCE, they are saying bullish above 0.60, and bearish around 0.30??!! We saw one of the biggest market slides ever happen from 0.47 in February of this year.
Could we be in a throw-over of an Ending Diagonal?
DeleteBarron's Headline on Pfizer:
Pfizer Denies Its Vaccine Production Is Suffering New Delays
https://www.barrons.com/articles/pfizer-denies-its-vaccine-production-is-suffering-new-delays-51607041268?siteid=yhoof2
Perhaps yesterday's piece on PFE was designed to draw in some fresh shorts to squeeeeeze?
SPX stocks above 200 dma. At 92% and NAAIM exposure at 103%, down from 106% last week. Fear & Greed last week hit 93.
ReplyDeleteSemiconductor stocks above 200dma in nose bleed territory. Stock/bond 30 year ratio at levels where we crashed in March.
DeleteES 1-hr - another marginal high on a further divergence with the hourly MACD. Still possible for a wave (v).
ReplyDeleteTJ
SPX weekly - above BB and touching upper TL. of megaphone pattern. Frothy
ReplyDeleteES 30-min; limit for the up move as (v) is 3,695.00; beyond must consider the diagonal ended earlier and was leading, and the up move is a third wave of some type. So far, at 3,693.25 it hasn't been crossed yet.
ReplyDeleteTJ
My data feed says that high already exceeded in the cash session...
DeleteI don't see any higher than 3693.25 on cash right now. Which data feed? Thanks
DeleteHighs (Think Or Swim)
Delete3693.25 - /ES Futures
3693.42 - SPX
That's what I have, thanks
DeleteI agree, any higher and I think we are in wave 3 higher to 4096 next fib.
ReplyDeleteA few analysts I consider to be very good called a third wave up a week ago. I seem to recall someone on the blog making a derisive comment when I mentioned the possibility and while not yet confirmed, it is certainly looking more possible. I was expecting at the very least a tag of 3700 and that would invalidate the diagonal. I would not personally consider that a bullish sign unless we get two closes above...
Deletehttps://www.bloombergquint.com/markets/mystery-surrounds-7-billion-outflow-from-vanguard-s-p-500-fund
ReplyDeleteHaha just saw that. Glad you posted
DeleteMaybe some CBs: BOJ, Swiss National Bank
DeleteI believe this diagonal is possible, as well as the non overlapping impulse https://invst.ly/t1g40
ReplyDeleteA new post is started for the next day.
ReplyDelete