Overnight the intraday screen was not in the same set-up as in the previous two examples. The ES 30-min chart gapped higher, and made a tick new high which did become a valid up fractal. Then, it traded mostly sideways to down, eventually filling the gap - see the black circle in the price chart. The intraday slow stochastic did not become embedded until after the cash market was open for a few hours. As it did, today's up fractals were broken higher.
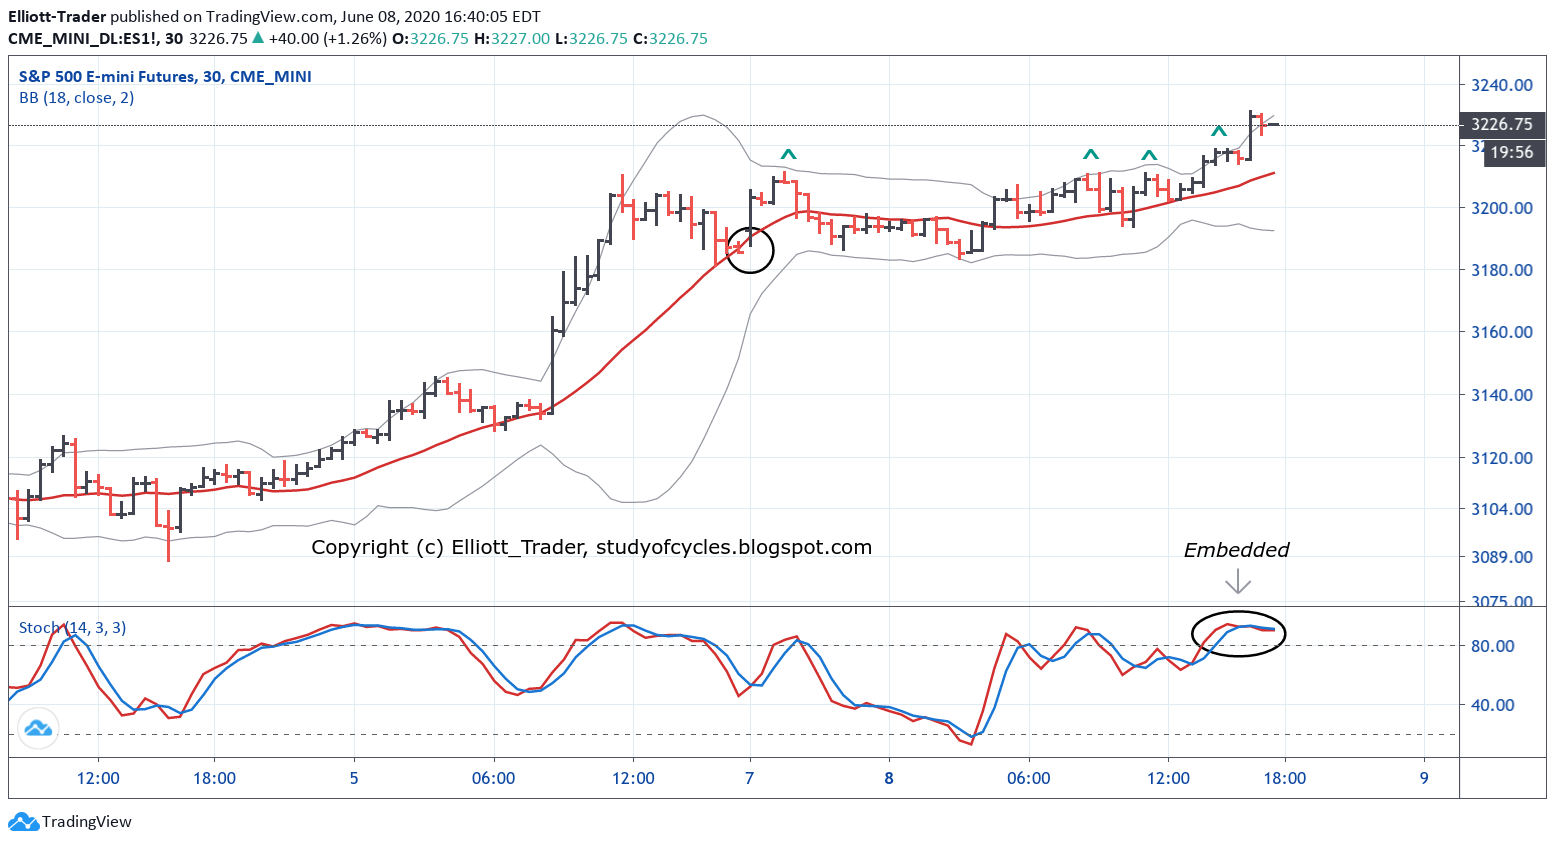 |
| ES Futures - 30 Min - HH Day |
It is possible today's structure made a barrier triangle or a flat and a series of smaller i, ii's. Regardless, today became a higher higher (HH) day, and the prior (c) = 0.62 x (a) Fibonacci relationship shown on the four-hour chart was broken. This ups the odds of being in the Minor C wave. Today made a more typical pattern for the intraday slow stochastic. There were no instances of having more than two consecutive closes over the upper band. Still, the grind resulted in higher prices.
The ES 90% retrace level is at 3,270, and today prices traded slightly over 3,231, which was the R1 daily pivot (classic calculation).
I had to wait until 6 pm to get the data for this chart, but it bears paying close attention to. There are very few lower numbers in the series, and it should be treated with some respect.
I had to wait until 6 pm to get the data for this chart, but it bears paying close attention to. There are very few lower numbers in the series, and it should be treated with some respect.
 |
| Put/Call Ratio - Daily - Near Historic Lows |
Have a good start to the evening.
TraderJoe
ET, If today was gap up for 3 of 3 of C of ((B)), 3530 is a possible target for ((B)) to end. Weekly AO turned positive, need to see if it stays that way. Debt to GDP 110% this year and 136% next year. That should take the wind out of our sail.
ReplyDeletehttps://www.thebalance.com/national-debt-by-year-compared-to-gdp-and-major-events-3306287
the stock market goes higher the more debt we have
Delete10 trillion dow 10000
20 trillion dow 20000
30 trillion dow 30000
I updated this post with an additional chart after the close. I personally have not seen put/call ratios this low in the roughly four-five years I've followed them. They are lower than at the prior top & the top before that. And the 10-day moving average is currently declining steadily.
ReplyDeleteFibonacci retrace in spy using some points in your awesome post on 6/6/2020:
ReplyDeleteTrend Begin: {your (4)} Low 1/22/2016 at 181.02
Trend End: {your 3 of (5)} High 1/26/2018 at 286.63
Retracement: {your (A)} 12/28/2018 Low at 233.76
85.44% of Trend Begin to End, starting from Retracement = 323.99
Note that 100% of Trend Begin to End, starting from Retracement = 339.37 and the Feb high was 339.08.
Also Note, applying negative 14.56% below the Retracement low = 218.38 and the 3/27/2020 low was 218.26
TerryO
Classic, High degree 2/B waves can indeed generate even more bullish fremzy than at the prior top. High degree second waves are notorious for their ability to convince the herd the prior trend remains intact. We all know this but it is still surreal to see it play out in real time. VIX has an open gap at just over 18.
ReplyDeleteI always suspected it was not purely a function of the put call ratio...
not sure what "it" is, but I never said anything was "purely" anything. P/C is a more useful indicator; nothing more.
DeleteET: Does the p/c ratio not fit ideally for the end of a B wave??
ReplyDelete..or the fourth wave of 'C'. It could back off a bit, and then come down again. I wouldn't be so 'rigid' in the count at this time.
Delete"upping the odds" is not yet full agreement ..as I said, would need to see a fourth wave down and a fifth wave up. Please don't put words in my mouth to suit your ego or your purposes.
ReplyDeleteI think 4 of C is likely but to the upside. Pause at 3200 hinting at another upside wave and this move down being corrective...
ReplyDeletesee the new post started for the next day.
DeleteA new post is started for the next day.
ReplyDelete