As I stated in the year-end video, the biggest thing the stock market has going for it is that the NYSE Advance / Decline line is, as of Friday, at new all time highs, chart below.
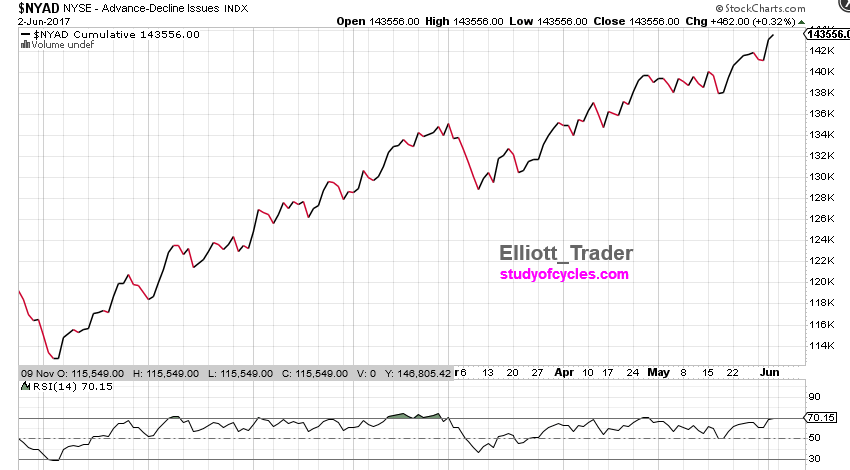 |
| NYSE $NYAD Adv-Dec At New All Time Highs |
If this is the biggest thing the market has going for it, it is also the biggest reason NOT to call Primary 5 as being over yet. Robert Prechter insinuated in a newsletter a couple of months ago that he was wondering if it 'might' be over. Well, as far as I know, there is no bear market that has started with the $NYAD not diverging from price, and right now it does not. The $NYAD is at new all time highs right along with the Dow and the S&P. With that in mind refer to the chart below for the larger picture.
 |
| DJIA Daily Closes with RSI (14) |
Assuming the Primary 4th wave (Circle 4) ended in February, 2016, as I called for, then there are potentially several ways to count the up wave, but I think several factors rule out the numerous possibilities and narrow it down to one. So, let's get to work.
If we are making a Primary 5th wave up, (Circle 5), then it should be composed of five Intermediate sized waves, labeled (1) through (5) on the chart above. With the $NYAD at all time highs, I do not think we are anywhere close to the fifth wave, (5), yet. In fact, I think we are only in the Intermediate (1) one wave up.
Most market analysts agree there was a peak in April, 2016, and a trough in May 2016. They have labeled these as 1 and 2. I disagree. I have labeled them as A & B, because if they were labeled 1 & 2, then the November, 2016 election low would "cut off" a trend line from Primary 4 (Circle 4) to their 2 wave label, violating a guideline that no part of wave 3 should fall below that trend line. Further, the B wave only retraced 38.2%, which is less common for a second wave. Not impossible, but less common. You see a 38.2% retrace for a second wave most often occurs when the first wave is the extended wave in the sequence. Clearly, if the April, 2016 high was wave 1, it is not the extended wave in the sequence since there is a much larger wave after it.
Rather, it's my opinion we are in an impulsive C wave up of Intermediate (1) of a likely ending contracting diagonal for Primary 5. The RSI (14) clearly tells us we have seen a third wave of some degree, but now price is diverging from it, and the Elliott Wave Oscillator is too, as I showed yesterday.
If we draw a potential channel around the C wave impulse, we see that wave ((iv)) or circle-iv has not yet touched the lower trend channel boundary. Price has fallen below the mid-channel line once, and has rebounded to it, but it has not yet attacked the lower channel boundary. Further, we noted that, in the Dow, C = 1.618 x A would be at 21,374 or thereabouts. So, there is still room to go to make that measurement. But I think one of the key reasons to label this upward wave a Minor C wave is that it has the common characteristic of a C wave - which is a lack of significant-sized pull-backs. Whether a crashing "take no prisoners" C wave to the downside, or a more rare C wave to the upside, they would still have the similar characteristic of not taking big pull-backs. Isn't that what we are seeing?
I have seen in re-drawing this structure with all of the intervening wave labels that I made a mistake on some blog posts in the labeling of the upward (b) wave, and the downward (c) wave, and wave ((iv)) or circle-iv. I had previously referred to this fourth wave as minor 4. It clearly can be seen that the correct degree of this wave would be minute ((iv)), and upward (b) wave is minuet (b), not minute ((b)). This was a mistake only - not a change in market view of any type - and the wave labels from the above chart will stand, and future charts will show the correct degree.
If after minute ((iv)) or circle-iv completes, we get the minute fifth wave ((v)) to complete Minor C of Intermediate wave (1), up, it is at that point, we should begin roller-coaster ride inherent in a diagonal that would cause the advance-decline line to diverge. In this scenario, there are four more waves for this to occur, in Intermediate (2) through (5). In many other Elliott Wave scenarios, there is only one more wave for this divergence to occur in. That seems unrealistic to me.
But keep in mind, that if a diagonal wave should be made, that price does not have to make explosive new highs. It only has to make marginal new highs. And that is the key to this count.
So, what about this closer in and potential minuet (c) wave down of minute ((iv)) or circle-iv? How could that happen? Well, is it possible that price will sell down into the upcoming Federal Reserve rate decision meeting, and then, when either the Fed does or does not raise rates the market will have a relief rally - either because the rate hike is over with, or because they do not raise rates? And then make a new high? It's just a thought. It doesn't have to happen that way. But, it is at least plausible since we have just seen new all time highs for this rally.
Anyway, you again have a recap of a scenario I have in mind for the larger Primary Wave 5. Since the S&P500 definitely did not make a triangle for it's Primary Wave 4 (we clearly demonstrated in the SP500 the count downward was a double zigzag W-X-Y), then it is possible the largest Primary 5 wave in history - potentially ending a Cycle and and a SuperCycle will end as a contracting diagonal. We don't know for sure.
But, in any case Primary 5 does not look to be over yet.
Have a great weekend, and thanks for following our thoughts.
TraderJoe
Joe,
ReplyDeleteI don't comment that often so I'm pleased to be the first one to comment on this post. I think most of the people following your blog have an immense appreciation of the work you share with us. When you make a statement that something was a "mistake" it shows honesty and character, which I've never seen in other sites. However, I do wish to take issue with the situation you characterize as a mistake. While I am not an expert in wave analysis, but rather a novice, I do recognize that EW is 100% accurate in hindsight but is a fluid situation rife with multiple possibilities in real time. I suspect that some of the critical comments I see here are from people who have had losing trades because the outcome was not the one you expected and therefore blame you for the loss. They don't understand that EW is not without risk and it is up to each of us to manage that risk. I think you are being a little harsh on yourself referring to the degree change as a mistake. It was the most probable assessment with the information available at the time. So not a mistake, just a different outcome after more info was available.
I do have one question.
The Russell has been the weak sister but has greatly out preformed the other indices over the last several days. I want to ask if your opinion is that is is going to catch up and get in sync or if it is beginning it's divergence earlier than the other indices since it is made up of lower quality stocks.
Hi PT - Thanks for your comments. But, it was a simple error: an error in transcription. If you will refer to the prior YouTube video at this link (https://www.youtube.com/watch?v=C_twzfUCifs) at minute 6:11, I had clearly labeled minor wave A & B in the Dow. That means all the subsequent wave should be minute waves (not minor waves) until Minor C is reached. Somehow, while I wasn't thinking clearly, I inadvertently referred to the fourth wave in the series as minor 4, instead of minute ((iv)). It's just an error. What is not correct is the position of minute ((iv) as shown on that same diagram. It is likely 'too small' of a wave to have corrected all of minute ((ii)) because it is too short in time. I have been giving the time parameter a lot more weight in the proper labeling of waves. In general, I want to see wave fours longer in time than wave twos. And, there have been times in the past when I have not appropriately done so.
DeleteI'll try to take a more detailed look at the $RUT on Monday.
Regarding whether people make money or not. I apparently need to restate (not only that I am not providing trading or investment advice), but also reiterate what I have posted in the past : my paraphrase of Ira Epstein's Guidelines for trading. They appear at this link in the blog (http://studyofcycles.blogspot.com/2015/11/paraphrase-of-ira-epsteins-rules-for.html).
DeleteFrom some of the comments I get, it seems there are people just dyin' to short apparently. Yet prices are over the 18-day SMA and the slow stochastic on the ES is still embedded over 80! Ira says no short sales unless price closes below the 18-day SMA and the slow stochastic drops below 80. He wants you to have the wind at your back for a short sale.
But, he also says "no new buying at this upper Bollinger Band", as the Smart Money will likely use the upper Bollinger Band as a place to 'take some money off the table' because the probability of prices closing outside of the band on any one day is only 5%.
Taking money off the table (i.e. booking some profits) is a way different activity than going naked short.
This is what Ira 'teaches' about trading. Some people just don't get it. Some people just don't want to understand there is a time to do nothing - but count the waves.
Joe
Hi TJ,
DeleteWhy run the risk of saying the b way will end soon? The market is not showing any signs of letting up. Leaders are strong. No signs of institutional selling. And we are getting healthy rotation.
Hi Todd. Plot the bullish percentage (using Stockcharts.com) as $BPSPX over the last six months. From March to now, does it look like a bull market? Does it look like a third wave up? Deterioration under the surface. Also, the Daily RSI and EWO diverge here, as I've said several times.
DeleteThanks for your reply. I'll keep an eye on those indicators. I don't use them.
DeleteHi Joe,
ReplyDeleteI greatly appreciate and enjoy your posts. There was a post called "a prediction from the year 1819" around December 2016. I don't see it anymore. Has it been deleted? Thanks.
Hi John. Yes, it was unfortunately deleted in the effort to get Google Blogger working again. Needless.
DeleteSalut joe
ReplyDeleteMerci pour les graphiques
On voit maintenant ou l'on se trouve actuellement
HI joe..Thanks for all of your posts and contributions to the EW community. You may have already eluded to this possibility but is one of your alternate counts for the Dow since the Feb 2016 low perhaps not an ending diagonal and still in wave 4 of 5 of the last impulse up for a top? This of course would consider the current new high today 06-08-17 wave b of an expanding flat correction beginning at the April 2016 low for wave a. I just wanted to see if you agree with this alternate possibility. Thank you
ReplyDeleteNM Joe..Todays post on your most recent count answered my question..many thanks for all you do. Best Regards
Delete