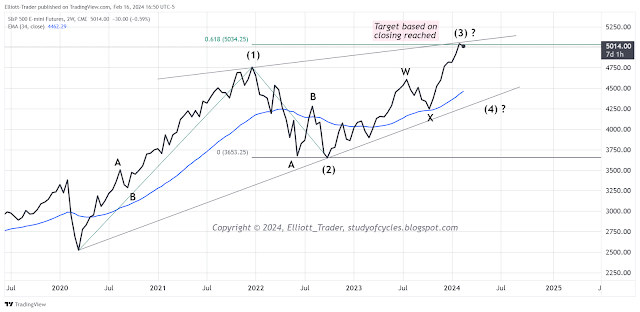
According to the contracting diagonal interpretation of the current up wave, one target was reached in the last week. That target is based on closing prices on the 2-weekly closing-only chart below.
The target reached was (3) = 0.618 x (1) based on closing prices. This target was anticipated as it is a common measurement in larger diagonals.
We are categorically not saying that the up wave is over. There are ways we can see upside squiggles yet. All that is being said is that a target has been reached, and if the up wave gets beyond (3) = 0.786 x (1), then the pattern would tend to lose the "right look".
Another item we are noting is that risk is getting higher with each passing day. For example, if you are one of the people that thinks every Friday must be higher because of the day-of-the-week, well, "first it wasn't, then it was, then it wasn't again".
From an Elliott Wave perspective, we can still see how some fourth and fifth waves higher on smaller degrees could proceed higher. We're not interested in them. They will be fraught with large twists and turns during which a wrong move could be costly - more costly than likely upside reward at this point.
Rather, we are looking for confirmation that a down trending wave on the swing-line indicator with closes under the 18-day SMA has begun. This might include the breaking of a daily trend line by a significant amount, then a back-test, and then a failure of that back-test. Until we see such, there is primarily conjecture.
Have an excellent start to the evening and the weekend.
TraderJoe

That structure has significant implications for equities.. I am thinking about the rule/guideline regarding CED retracement times. It is also, if correct, right in line with my opinion that Powell is engaging in a bit of mendacity with hints of rate cuts..I would like to know exactly who is "pricing in" 4 to 6 rate cuts this year and why! 😊
ReplyDeleteidk it looks to good to be true. But it does look perfect up to this point. Wave D would come in @ roughly 4400 and then rally up into Sept-Oct. . From the Oct 13th 2022 low could the alternate count be a wave 5 now into the present level? Thanks
ReplyDeleteHi ET, thanks for posting your work with this educational aspect. Just out of curiosity and for your information, at this time, Neely's analysis in a promotional email is similar (not the labels but the trend forecast), with a 4600 target for S&P cash.
ReplyDeleteI found it interesting that despite very different labeling, the image at this point is almost the same.
DeleteMarty Armstrong expects a 15% decline which he says will be a buying opportunity and SHTF time later this year...that deep a decline would break the CED but could still be a 4th of some kind.
DeleteNice well defined triangle on Bitcoin 15 minute.
ReplyDeleteA new post is started for the next day.
ReplyDeleteTJ.