Wednesday, March 31, 2021

While Waiting ...

While waiting to see whether the new month brings the typical inflows or not, here are just a couple of technical charts that indicate a bit of divergence in breadth and volume at the highs.

NYSE Adv/Dec Line - Daily - No New High Yet


NYSE On Balance Volume - Daily - Lower High

Today's higher high in the ES daily futures likely confirmed we are in the minute ((c)) wave of the Minor B wave in the count we posted yesterday. There are no changes today.

Have a good start to the evening,

TraderJoe

Tuesday, March 30, 2021

Relevant Charts

Following on to yesterday's post, below is a close-up of the ES Daily chart and the likely wave structure  of the Minor B wave up, of what is likely a flat wave.

ES Futures - Daily - Minor B, Up
 

The B-3 wave could typically go up as high at the 1.382 external Fibonacci retrace of the recent A-3 wave down. It has already exceeded the 90% level, and therefore fully qualifies for the B-3 wave of a Flat. The B-3 wave should, like the label suggests be made up of three minute waves. Unfortunately, as it is a B wave, it could also truncate at any time (on an errant news story) as it has already made the requisite 100% level. But, this count is trying to be mindful that April 1 could see the typical beginning-of-month and beginning-of-quarter inflows.

Bearing in mind the wave labels above, that places the various wave degrees as follows (using the SPY 15-minute cash chart).


As far as I can tell, we made five-waves-up in a contracting wedge and on a declining Elliott Wave Oscillator. This morning we gapped down, made a lower low, and then began an all-day corrective sequence. 

If tomorrow is the end-of-the-month, and end-of-the-quarter 'window dressing', then the sloppiness could lead to a lower low for minuet (ii) of minute ((c)). If the wave structure caves in, instead, on additional difficult news - margin calls, etc. - then watch last week's low labeled as a 'Key Wave Marker'. It is possible that the Minor B wave high is already in, and that is the alternate on the chart. Still, we should count with the trend until that no longer seems possible.

Have a good start to the evening.

TraderJoe


Monday, March 29, 2021

Difficult to Say

The wave structure is so sloppy it is difficult to ascribe any particular degree of certainty to the count. But if I don't change any prior wave labels, then it is possible we are still in the Minor B wave, up, of the second Intermediate (X), as shown below.

ES Futures - 2 Day - Price in a Wedge Currently
 

As per the comments, it is not possible at this time to ascribe ending diagonals to the cash markets, and price has not yet hit the level of 1.382 x A. 

During the latter portion of the month of April, it is possible for this Primary ((B)) wave up, to take up more time than the previous Intermediate (B), up, of Primary ((A)), down.

Have a good start to your evening,

TraderJoe

Sunday, March 28, 2021

Weekly Fibonacci Levels

The primary purpose of this post is to look for Fibonacci levels which may be relevant if the market continues to rise. So, both Fibonacci extension levels and Fibonacci external retrace levels are shown.

ES Futures - 1 Wk - Fibonacci Levels

Readers can see there is a Zone of Confluence in a range of 4,100 to 4,155 should the market cross the 4,010 level first. The trend lines right now are dotted because the market may try to adjust them into more of a channel; either pushing out the higher one or dropping the lower one. It is objective to say that this week the market found support on/around the 1.382 External Fibonacci retrace. The market has to take out that low to say something different.

One of the most significant features of the chart, besides the current wedge, is the lack of time taken by the downward retrace waves in comparison to their upward wave counterparts. This is somewhat odd and will likely be corrected at some point. However, it is a characteristic market behavior when the FED gives permission to banks and other corporations to buy-back large quantities of their own stocks, and - make no mistake - they are doing that. For further information on this topic, you can see that even during the pandemic (second half of 2020) Corporate buy-backs are on the rise again; check this LINK.

Keep in mind that Wednesday is the last trading day of this month and this quarter, and Thursday is the first day of the new month. So, there may be the additional inflows on Thursday from company bonuses, pension funds, 401k's, dividend reinvestment plans, etc.

This is the second post since Friday, and if you haven't read the first one yet, you might like to now. Have a great rest of the weekend.

TraderJoe

Friday, March 26, 2021

Five Up And Then Some

Let's cut to the quick. On the ES Daily chart, the Intermediate (Y) wave can still be in play. We said that was possible yesterday. Here's how.

ES Futures - 1 D - Potential Diagonal

In this case, the Minor C wave could be a potential ending diagonal. It may not be completed yet. Right now the structure has "the right look" and the right measurements. The A wave would count as an impulse with a triangle of some sort after  the 'spike' wave. 

Today, we did in-fact count five-waves up, as follows.

SPY - 5 Min - Impulse Up

After we counted five-waves up in the SPY, the low of wave (iv) was taken out in a three-wave down move that consumed very little time. We said prices could go over the high again. We said it yesterday, and we said it today. They did that. Because of the short length of time for the correction, we were looking for a "B" wave up to make an expanded flat, and a longer correction. We said, "look for 1.382" if they want to close it up over the high on a Friday. They did, but the final up wave turned out to be more than that in the last candle!

SPY - 5 Min - Impulse with add-on wave.

Because of the brevity of the downward wave, this looks like a wave in a diagonal with the last up wave part of a "C" wave within the diagonal shown in the first diagram.

Diagonals can be messy. It is extremely difficult to say if the prior high is wave (i) or (iii) of the diagonal. We'll have to stay tuned. Remember, potential diagonals are patterns that have to be proved. That means the interior waves should not exceed 100% of each other.  So far, they are fine.

Until we can do those measurements later on, have a very good start to your evening and to your weekend.

TraderJoe

Thursday, March 25, 2021

Battle for the Line in the Sand - 3

They don't call it a battle for nothing. For the fifth day in-a-row the ES daily futures either touched the 18-day SMA or came within whiskers of it. Today, at the end of the day, prices prices closed back up over the 18-day SMA. First, prices made the lower low we suggested and turned the swing line lower - with lower lows and lower highs - but a down trend was filtered out by prices temporarily closing back up over that 18-day SMA. So, the market is current neutral with a bullish bias. The daily chart is below.

ES Futures - 1 D - Neutral

Neutral is as neutral does. Neutral means neutral. It means that prices are approximately as likely to go up as to go down. The daily slow stochastic has 'worked off' an over-bought condition - with both the %D and %K lines (red and blue) closing below the 70 level.  The bias is positive. The three sarcastic postulates I cited for this market segment played out again today. As a reminder - 

  1.  No significant declines are allowed except in the overnight, until Europe closes.
  2.  Then, after the opening decline, the algo's are turned on to grind every tick, so that ..
  3.  Prices can close higher.

By 'grind every tick' I mean that virtually no retraces beyond 50% are allowed during the day. Here is today's intraday chart from the morning low.

ES Futures - 3 min Close - Only 38%?

As you can see, the largest retrace occurred in the afternoon and turned out to be only 38.2%. Then, the wave iii/c has almost no pull-back inside it. That's where the real 'grinding' occurs.

Bottom line, if this current three-wave sequence makes a wave iv and wave v, then after another retrace, higher highs might be expected still. Right now - even using OHLC candles - wave iii/c is shorter than wave i/a.

If price continues higher to make a new all-time high, then wave Intermediate (Y) might still be in play in this index. We'll address that as we see more. The wave sequences are getting increasingly difficult to count. This might be expected from a Primary ((B)) wave.

Have a good start to the evening.

TraderJoe


Wednesday, March 24, 2021

Battle for the Line in the Sand - 2

The battle for the daily 'line in the sand' continued today with prices penetrating it again today. However, by the futures settlement, a lower low day than that of 19 March was not created yet today. It still could be. The daily chart of the ES futures is shown below, with the daily slow stochastic indicator clearly not embedded.

ES Futures - 1 D - Pierce of the Line in the Sand

If prices begin to make lower lows under the 18-day SMA, then it is possible a trend lower will begin in earnest. Initial target would be the lower daily Bollinger Band, but other calculations have been provided earlier. The 1-Hour chart shown in yesterday's post can be modified slightly as follows to account for a third wave if one has begun in earnest.

ES Futures - 1 Hr - Failed Double Combination

We did try with the waves available to see if a triangle was being constructed. We said it didn't have to be. At this point, most contracting triangles have been invalidated, leaving only a potential barrier triangle, but there are not anywhere near enough waves to suggest that is occurring. So, in the interim, the suggestion is to draw in the declining channel at this point, and see if the channel holds.

Have an excellent start to the evening.

This chart was added as a P.S. Many, many technical indicators are price or breadth based. Fewer are volume based. But, I like to look at volume to see what is saying. Here is the daily chart of the ES with the On Balance Volume indicator.

ES Futures - 1 D - With OBV


As can be seen, the mid-March peak is the first once in this series in which the On-Balance-Volume made a lower high compared to prior peaks. Yes, since October of last year - while there have been a few back steps - in general OBV made a higher high or equal high at each rally peak. Not so on this last one. And, while not making any definitive claims, it is worth noting that volume did not follow the move up. If OBV should start making lows below the Oct/Nov lows it might be saying something much more conclusive.
 

TraderJoe

Tuesday, March 23, 2021

Battle for the Line in the Sand

After yesterday's low volume day on SPY, the market moved lower today. To make a long story short, prices got back down to within two points of the Line in the Sand, the 18-day SMA, and by the settle, refused to touch it exactly.  The ES daily chart is below.

ES Futures - 1 Day - Battle at the 18-Day

The daily slow stochastic appears to have lost its embedded status.  Intraday we began counting as the potential w-x-y wave upwards, and we warned blog readers to watch out for a possible failure of the y wave. From what we can see at this time that failure very well may have occurred as the ES hourly chart shows below (at the red * ).

ES Futures - 1 Hr - Failure?

Prices hit the mid-line of the channel - which was more than 78.6% of the way to the w wave, and then fell off rapidly. This can make an excellent second wave location, (ii), for a further move lower. As long as price remains below the channel, or back-tests and fails, then a further move lower might be expected.

On the ES 30-min intraday wave counting screen, below, we note that the 3,890 level, the low of the day is a 78.6% Fibonacci retracement from the low. Prices overlapped the a wave up, as we said to watch out for yesterday. This created one level of confirmation in a move lower. But they have not yet taken out the lowest low of the b wave just yet. If they do, that would create a second confirmation.

Similarly, closing below the 18-day SMA might lead to a move to the lower daily Bollinger Band.

Here are a couple of charts added shortly after the open today.

NYSE Adv/Dec Line - Daily - Close

 
NYSE McClellan Oscillator - Daily - Close


Have an excellent start to the evening,

TraderJoe

Monday, March 22, 2021

SPY Volume Low Today

Below is today's 15-minute chart of the SPY. This was being monitored for volume characteristics today - to see how robust the up wave might be. As you can see for yourself, volume was pretty darn low: some of the lowest we have seen.

SPY - 15 Min - Low Volume

There are currently only three waves up in this chart from the low on 19 Mar, and they currently measure as c = a. Whether or not that relationship holds or breaks remains to be seen. However, should the down movement continue from this afternoon's high, one might watch first watch for an overlap of the a wave, up. Then, watch to see if the b wave down is broken as more signs of confirmation.

In the futures market today, we noted that ES prices had touched the underside of the potential lower diagonal trend line on the 4-hr chart. That is shown as the orange dotted line extension in the chart, below.

ES Futures - 4 Hr - Back-test of Diagonal

We indicated live-and-in-real-time that there should start to be a significant turn in that area if the potential diagonal is to play out. Prices then backed off of the high. So, the up move may be over in cash. And it may be over in the futures. But, the overnight sometimes makes a few shenanigan waves, and it might be possible for one more slightly higher high in the overnight.  Prices settled near 3,932 today. If they got up and over 3,965 that would see them trading back in the diagonal, and likely be a real warning to watch for a diagonal invalidation. We'll address that situation if we see it.

Have a good start to the evening.

TraderJoe

Sunday, March 21, 2021

End of A Cycle?

Some of the readers of this blog have asked that I have a look at the long term 30-year US Treasury Bond future. For those of you who don't like diagonals, you will hate this post. First, it appears to me that the Cycle A wave up from 1980 is an impulse wave. I am not showing this part of the count. Readers of this blog might like to try to plot the wave from 1980 to 2001, and try to find the impulse portion of it. No, what I am showing is the Cycle C portion of the wave from the Cycle B low - in late 2000 - to the present.

ZB Futures - 1 Month - Expanding Ending Diagonal


Within this larger expanding Cycle C diagonal, which meets all of the time and price parameters of an Expanding Diagonal of the 3-3-3-3-3 form, there appear to be fully three other long-term diagonals! Each of these three smaller diagonals is an Intermediate (A) wave of the larger Primary wave. The first diagonal (A) wave is an expanding diagonal, itself, a fractal of the larger form. The other two Intermediate (A) waves are contracting diagonals.

One of the clearest non-overlapping waves is the terminal one - the clear impulse Intermediate (C) wave of Primary ((5)) of Cycle C. 

Such a chart predicts that the start of the diagonal will be eventually exceeded lower in less time than the diagonal took to build. Of course, there are fully 20 years for that to happen! Yes, it may happen in less time, but along the way there will be numerous pull-backs (upward retraces) before cracking the lower trend line.

Again, for those that don't like diagonals - or that don't think diagonals exist - this chart is clearly not for you. But, if you are open-minded, perhaps you will recognize that it is almost impossible to count this wave in any other fashion due to all of the overlaps. And, of course, such a chart fully reflects the central banks' expansionary money creation, as well as their herky-jerky attempts to "twist" or "taper" their strategies seemingly without rationale. Thus, perhaps this chart will add a tool to your Elliott wave tool-kit to assist in counting market waves accurately.

This is the second post this weekend, and if you have not read the first one, you might like to read it now. Have an excellent rest of the weekend.

TraderJoe

Friday, March 19, 2021

Loss of Embedded Stochastic

The ES daily chart lost the embedded status for the daily slow stochastic by closing under the 80 level today. Futures actually settled about 3 points lower than this, but the value is 79 even at this level.

ES Futures - 1 Day - Tag of 18-day


In doing so, prices reached down into the "line in the sand", the 18-day SMA. Then, the futures bounces off that level. In the futures, see chart below, we counted five-waves-down using The Eight Fold Path Method for Counting an Impulse (see the featured post in this blog in the upper right-hand corner of the main page.)


Note that wave iii is the steepest wave of the group, and wave iv alternates with wave ii. Further, wave iv is longer in time than wave ii. There is a new lower low on a bar chart at v. It is not a truncation. We indicated that the fifth wave down should end on a divergence with the Elliott Wave Oscillator. It did, and the up trend began. So far, it looks like we have five waves up to a micro-A wave, ((A)), and all or some of the micro-B wave down, ((B)). Because of the timing involved, we have sketched out a couple of paths for the correction. The circled letters show a simple zigzag. That is possible, but seems short in time. A double-zigzag (not shown) certainly can occur also. 

But, in red is shown a third possibility, and this would be a more insidious flat wave: a down wave that again bangs into the 18-day SMA, after another marginal higher high, maybe even drops below the low of wave v, and then heads up in its micro-C wave. Such a wave - if it plays out that way - might give the S&P500 cash chart the appearance of having made five waves down. Corrections are messy. Welcome to the mess!

If at some point price begins making daily closes below the 18-day SMA, then a downward trend might be seen to result.

Have a good start to the evening and to your weekend.

TraderJoe


Thursday, March 18, 2021

ODD - Outside Day Down

It has been fairly ODD lately to see an outside-day-down, and an outside key-reversal day at that. Near to the futures settle it was confirmed that this outside day down candle will hold into the settlement. The day is a key reversal day also because it is the highest high day of the uptrend.

ES Futures - 1 Day - Outside Day Down

At this point, while the daily slow stochastic has curled lower, it has not yet closed under the 80 level. It might. As usual, price should not take out the high of an outside day down within two trading sessions or else it can constitute a trap for the bears.

With today's lower close, the daily count shown yesterday (at the top of yesterday's post) remains the same. In terms of the ES 4-hr count, it is highly possible a potential contracting diagonal has completed. The alternate for the count has to be some kind of fourth wave.

ES Futures - 4 Hr - Divergent Higher High and Drop

Last night we said a little consolidation and a pop higher would be a nice way to finish the potential diagonal. That did occur in last night's overnight session. None of it shows up in the cash market. As shown, today's downward wave is longer in price than the wave shown as wave (ii), but has not broken below the wave (ii) position yet. It might. In order to confirm an ending diagonal, price should trade below the low of the minute ((b)) wave in less time than the diagonal took to create. The location of interest is shown on the chart. Clearly, if this occurs, the wave will also overlap the ((a)) wave, up, and that would invalidate the fourth wave of a potential impulse if some are counting one-to-five.

Should the diagonal be confirmed, then the first target for a C-5 wave down would be below A-3. A second target would be at 3,600-15 which is the 1.62 x A-3 wave, added to the B-3 wave.

Have a good start to the evening.

TraderJoe

Wednesday, March 17, 2021

Marginal Higher High - 2

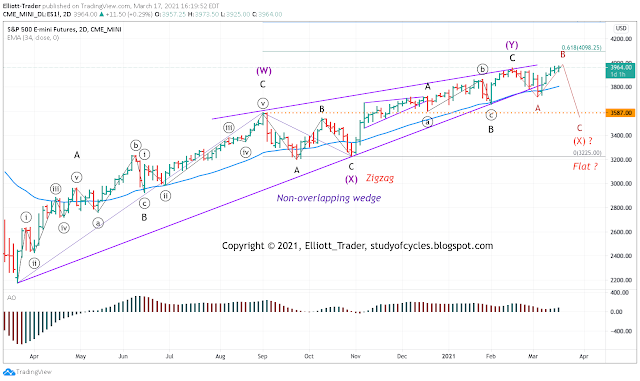
A lot of hot air went into FED Chair Powell saying, essentially, "the economy will likely rebound from pandemic conditions, and we're not changing rates while it does." Simple enough. Stocks made another marginal new high on the move. So, yesterday's price chart remains the current count.

ES Futures - 2-Day - Still in the Wedge


So, now we'd had the fact of a third stimulus stimulus, and the FED's statement and news conference. Let's see (tap..tap..tap..). What else is on the horizon? Well, there's the possibility of an infrastructure bill, but that is probably down the road a bit. It's not that prices can lift off on their own, I'm just looking for possible announcements to keep in mind.

Meanwhile, in the comments we were only able to count "three-waves-down" on the smaller ES 15-minute time frame. We posted that, and even posted that most likely the one-minute diagonal we counted yesterday was 'most often an A wave'. It was. Then, on the ES 4-hr chart, this possible count to a Minor B wave was suggested.

ES Futures - 4 Hr - Possible Minor B Wave?

Again, because this count involves a possible diagonal - just for the minute ((c)) wave - then it must form properly in every detail. Such a chart would look better if there is some digestion of today's gain, and then the length of a fifth wave v would have to remain shorter than wave iii.

Well, we'll see how it goes. Have a good start to the evening.

TraderJoe

Tuesday, March 16, 2021

Marginal Higher High

Today's marginal higher highs in the ES and YM futures changed nothing in the larger picture. The daily count remains the same, and is shown again below on the ES 2-day chart.

ES Futures - 2 Day - Possible Flat (X)


With nothing else to do but wait for the FED report-out and press conference tomorrow, today we had some fun with the one minute ES chart. First, we counted out this expanding diagonal live and in real time on the 1-minute chart.

ES Futures - 1 Min - Expanding Diagonal or TZZ

Then, when wave ((5)) reached 1.618 x wave ((3)), we noted that, and in the chart below, the retrace began, and smacked directly into the upper diagonal line, before easing off.

ES Futures - 1 Min - Retrace of Expanding Pattern

Tomorrow the count may be subject to what the FED says or does. For a further downward wave, the high should be respected. For the triple zigzag or ending diagonal alternate, price would go over the high. As a triple zigzag, it is highly possible that the down wave is a second wave. Why it might exactly match all of the parameters of an expanding diagonal leaves one's head scratching. The point loss was relatively minor on the day.

Have an excellent start to the evening.

TraderJoe

Monday, March 15, 2021

Higher Highs Still Diverge

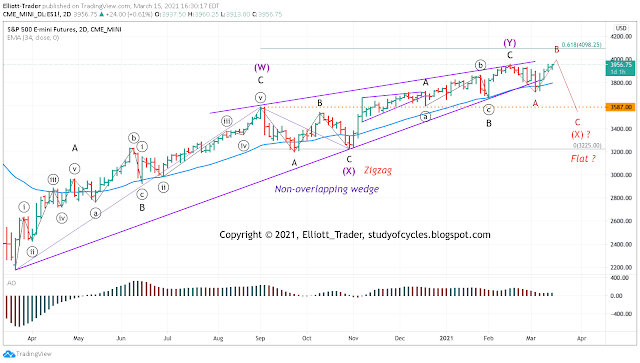
Today's higher high waves still diverge from the EWO on the 2-Day chart. The count has not changed, and remains as shown below on the ES futures (the Dow has a slightly different count shown earlier).

ES Futures - 2 Day - Possible Next (X) Wave


The advantage of this count is that is it would provide some alternation in the (X) waves if it occurs as suggested. It might also drop the lower wedge line to form a parallel with the first (X) wave. Making another (X) wave is a further way to prolong the Primary ((B)) wave in time. It is about a week away now from a full year.

Have a good start to the evening.

TraderJOe

Sunday, March 14, 2021

Rate Move Nears Equality

A brief look at 10-year Treasury Note rates shows two distinct channels. This is true whether the note futures or the rates are considered. A daily chart of the rates is below.


At this point, a Fibonacci ruler shows that the rate moves have approached equality, with C/3 = A/1. In Elliott Wave work, one commonly ascribes the faster move to the "acceleration channel". As long as prices remain in this channel, then one has more reason to lean towards the 3rd wave rather than the C wave interpretation.

However, rates have not yet come down to try touching the lower boundary of the acceleration channel yet. A key to a longer third wave would be how rates react there. At this point, the MACD is strongly positive, although the histogram diverges a bit. But, there is nothing yet except some overlaps to suggest that the move has given up at this location. Therefore, the labels A/1 are equivalent, as are C/3. Consider them only like the 5-3-5 labels they are so far.

One item of consideration is the relatively brief down wave for B/2. While the acceleration channel argues for a third wave, that brief down wave is somewhat of an offsetting factor. 

This is the second post this weekend, and if you have not read the first one yet, you might also like to read it.

Have an excellent rest of the weekend.

TraderJoe

Friday, March 12, 2021

Trillions More - Dow at 61.8% Extension of Intermediate (W)

Stimulus was passed and signed off yesterday in quantities of more than a trillion dollars. The Dow is now at the 61.8% extension of the Intermediate (W) wave - which we have written before was a real possibility. No one has been more of a proponent of the Primary ((B)) wave, shown below, as this blog, since June of last year.

Dow (YM) Futures - 2 Day - Wedge

Diverging all the way against the Elliott Wave Oscillator (EWO) we argued that impulsive counts are nearly impossible except in discreet local areas. The price action has been wedging the entire way and the conformance to the wedge lines is truly exceptional. But more than that, we noted that the Dow can no longer overlap wave (W) with a shorter wave than wave (X). This entirely rules out the possibility of an ending contracting diagonal wave - for a supposed Primary ((5))th wave - that many might have been hoping for. We tossed out that idea long ago!

Currently, the symbol ((B))>, means the Primary ((B)) wave is continuing forward. We have little evidence of its having ended. It may stretch out to be longer in time than the Intermediate (B) wave of the Primary ((A)) wave, down.

On a more local level, intraday today, before the open we noted only "three-waves-down", and saw likely corrective possibilities. All day in the ES futures was backwards-and-forwards overlapping waves. Here is an ES 15-min chart.


Hopefully, the three-waves down is plain enough as ((A))-((B))-((C)). The ((C)) wave did not reach 1.618 times the ((A)) wave. The real lesson in the down wave is how - if one is expecting divergence to signal the end of the wave - it never happens. Up they go with a scrambled mess - leaving the possibility of a fourth and fifth wave in doubt for quite a while. This is one of the market's current favorite tricks: not making fourth and fifth waves.

Then, if one thinks they can count the up wave without use of a diagonal structure, I'd say they are sorely mistaken as this chart shows. Any other count would have incorrect measurements and/or overlaps that break the rules.

This is difficult wave counting: some of the most difficult I have encountered. Three items that are currently the most difficult are 1) no significant down wave will be made except in the overnight market, 2) all day long the algorithms are turned on to grind on every single tick, so that ...3) price increase occurs for the close.

Regarding item #1, yes, there are exceptions: down waves have definitely occurred during trading days. There are many examples. However, one must question this concept: why do all significant gaps occur as the result of overnight activity? Who has permission to do such things on the lower volume? Some of us really want to know.

Thus, there are many things to ponder into the weekend. Have a good start to it, and to your evening.

TraderJoe

Thursday, March 11, 2021

Just the Alternate Busted, Almost Uncountable Up Wave

Per today's comments, since the Russell 2000 (RTY) futures made a new high invalidating a downward diagonal, and since the alternate count of an expanding diagonal downward in the ES futures invalidated, that leaves the original count and a small truncation at the low. The NQ futures did not truncate the low.


The current up wave is nearly uncountable, possibly still a zigzag. And it may be a B wave of a Flat, since it has reached within 90% of the high. It is now legal to be a flat 'by-the-rules'. And, yes, this wave 'may' indeed go over-the-top if it wishes.

More later. Have a good rest of the afternoon.

TraderJoe

Wednesday, March 10, 2021

Stimulus Bill Passes on Weak Momentum

The stimulus bill passed both houses of Congress today. The market applauded weakly. If the market is making the expanding diagonal downward shown yesterday in the ES futures, then this might qualify as its wave (iv). This is shown on the SPY, below. I checked that the ES futures can count the same. This chart is just less busy.

SPY Cash - 15 Min - Diagonal c ?

Prices turned to the right, and traveled out of channel. They appear to be wedging now in what might be an ending contracting diagonal c wave. At this point, the measurement is c = 0.618 x a. Depending on what happens in the overnight, there might be one more last lurch up. Or, prices could give way and head lower. Filling the right-most gap (red circle) might be a sign that price is going to come down out of the clouds for now.

As I said in the comments, the above pattern can also be counted impulsively with the following relationship: v = 0.618 x net( i through iii). If the pattern is a-b-c, then its low should bust. If it is the impulse version, then new highs can be made.

The Russell 2000 futures are in an interesting location. They have broken their upper declining trend line. If the downward pattern is a leading expanding diagonal, then the high must hold. If, on the other hand it is an ending diagonal (or just the three zigzags shown in red in an expanding formation) then the prior high can bust. No matter how it goes, I'll respect the market's decision knowing that the pattern is at least counted correctly.

Russell 2000 (RTY) Futures - 4 Hr - Expanding TZZ or Diagonal

 In both cases I hope you can see how true Elliott Wave alternates can be formed.

That's it for now. Have a great start to the evening.

TraderJoe

Tuesday, March 9, 2021

A 'Possible' Local Alternate

This is based on the Russell 2000. The EWO and the EMA-34 suggest it is a good possible alternate. The chart otherwise speaks for itself.

ES Futures - 5 Hr - Expanding Pattern


At least it provides a clear invalidation point, which is useful in itself.

Have a good start to the day.

TraderJoe

Friday, March 5, 2021

Bottom Holds and Whip Around

Today, prices initially moved lower and failed to poke through the bottom again in the ES futures. The NQ futures did make a marginally lower low. So, this seems to indicate either a "b" wave location or an "x" wave location. 


With this in mind, while we can't have 100% reliability in the count above, we can say that the waves are counted as they occurred in real time. In fact, we counted today's down wave to ((B)) in real time on a one-minute chart. We counted three-zigzags lower in a contracting pattern. We said it could be a diagonal - leading or ending - or the three zigzags. It was the latter. We showed the numerical levels that such a diagonal shouldn't exceed. It didn't. We showed the back-test of the potential diagonal that would hold if price headed higher. The back-test did hold. Prices headed higher into the Friday close.

So, it 'feels' like a second wave. The upward retrace is more than 38% of the diagonal, and more than 50% of the entire down wave. Is it over? It doesn't have to be. There could be another pop up for the fifth wave of a ((C)) wave. And remember, to lengthen a correction in time there could be another (x) and a (z) wave. There is no certainty that will happen. Thus, we continue to count in real time until there is a wave structure that provokes more clarity.

Have an excellent start to your evening and to your weekend.

TraderJoe

Thursday, March 4, 2021

Two Items

First item: The Black Count it Is! Not reflected too well in cash, but fits like a glove in futures. Next wave down may be a correction (as in a Flat) or may impulse down. Too early too tell.

ES Futures - 4 Hr - Diagonal

Second item: some people have chosen to criticize the diagonal counts. Just for them, here is the Russell Futures four hour (4 Hr) count.

Russell (RTY) Futures - 4 Hr - Diagonal


Besides the fact that all the measurements are correct, and there is a numbered wave on every other side of the EMA-34, along with an expanding pattern on the Elliott Wave Oscillator, I really have only one other thing to say about this chart: there is literally no other way to count this mess (except as its triple zigzag expanding counterpart) because of the highly overlapping wave structure, and the constant push & pull throughout the trading day. In short, by itself, "It is not impulsive!

Finally, I have only one other thing of note to say today:

STOP counting cash! It is simply not reflective of the market prices made outside of the small window from 09:30 ET to 16:00 ET. Period.

Have a good start to the evening.

TraderJoe

Wednesday, March 3, 2021

Down to Lower Daily Bollinger Band

On the ES 4-hr chart, so far, this pattern is holding up as it is. Price would need to get up over 3,912 to invalidate it. As long as the pattern holds, it remains as is. The best alternate at this time is for a pattern that takes even longer downward - shown in red.


The alternate comes from two items: First, there is a non-divergent low as shown by the Elliott Wave Oscillator at wave (iii) / (i). Second, it is not possible to count cash in the same manner at the futures because (iv)/(ii) is longer in price in the cash market than (ii). So, it is possible (ii) is a 'b' wave. That is not the case in the futures market.

Anyway, doing the best I can with a very choppy wave. Today price got down to the lower daily Bollinger Band. The longer pattern might allow it to get down to the 100-day SMA. The alternate might become the main count on further development.

Have an excellent start to the evening.

TraderJoe

Monday, March 1, 2021

Still Very Dicey

Today we were counting in the upward direction both because - as we noted and often note - today was the "first-of-the-month" inflows expected from pension funds, 401k's, company monthly bonuses, dividend reinvestment plans, etc., but also because there was the potential for the fourth wave (iv), up, of a downward contracting diagonal possibly being formed. A reminder of that pattern is on the ES 4-hr chart, below.


Price today traveled upward - a lot! During the day, we noted that price had traveled back to the 18-day SMA, 'the line-in-the-sand' on the daily chart - and them some. We also noted that for the contracting diagonal to remain valid, price would have to stay below 3,914.75 or else wave (iv) would become longer than wave (ii). Price got to 3,912 before traveling a tad lower to settle at 3,900.00 in a nod to the "round-number" people.

It turns out that from this level price can still make a new low, down to 3,763 provided the up wave does not invalidate first. Will the pattern maintain it's integrity? We're really not that clairvoyant - we just count & measure waves, and see if they fit typical Elliott Wave patterns. However, we did place a Wave-Counting-Stop (WCS) at today's high, as if the 3,915 level is broken, the pattern would have to be something else.

Critics of Elliott Wave patterns could hardly argue though that these 'deep retraces' are not typical of what is expected in diagonals. Each of the two retraces is over 78.6% of their prior down wave. Students of the patterns might ask, "if the 78.6% level is fatal to a pattern, then why did the wave labeled (iii) make a new low?". It's retrace wave was in excess of 78.6%.

We do see from the above chart that the EMA-34 is still pointed downward, and has each of the numbered waves on either side of it for good form and proportion. Beyond that, analysis seems to be of little merit, and we must wait to see what occurs in the overnight. Traveling below 3,880 before making a new high might be more telling.

Have a good start to the evening.

TraderJoe