Friday, January 31, 2020

Careful about ((b))

It would be wonderful to be able to predict the stock market with a high degree of precision. But, Elliott wave theory has several features that just refuse to pin down the market's options. One of those is "B" waves. They can be almost "any three", from a flat wave to a zigzag, a double zigzag, a triple zigzag or even a triangle. With that in mind, below is an update on the daily projection chart.

ES Futures - Daily Close - Actual and Speculation

Today made a lower daily low. and it had more impressive initial statistics than the first down wave with only 173 advancing issues and 1,736 declining issues. This is now a 1:10 ratio, and might represent a "kick-off" wave. So, it does appear a correction - at least - is underway. And maybe more. Unlike yesterday, there was no big rally into the close.

The length in price of today's wave down, is also shorter than the initial leg down, and therefore, today's wave down can well qualify as a sub-wave of the next move lower. The DJIA darn well almost made a new low below the January low. The ES did not, and reacted off of the 78.6% retrace level of that January low. The down move is picking up speed and may be part of the minuet (c) wave of the minute ((b)) wave - but that remains to be seen.

From here on out, one must follow retrace levels and overlaps closely on any further the downward waves. Again, given the nature of "B" waves, we want to back-off and not try to call it too closely. Today's low did pierce the lower daily Bollinger Band, and then closed just above it. Meanwhile, the daily slow stochastic is not yet in over-sold territory. so there can easily be some follow-through to this initial move lower.

Have an excellent start to your weekend.
TraderJoe

P.S. Correction. On the day after this was written, two different sources showed the NYSE Adv-Dec figures were more like 549 / 2652. This is still in the impulsive category at greater than 1-to-4, but still not a 1 : 9, or 1 : 10 kick off. My apologies for the error. Data vendors are what they are.

Monday, January 27, 2020

Projection Update

Today in the comments section for the prior post, a reader asked that this projection chart be updated. Here is the updated version, per request.

ES Futures - Daily - Break of Trend

If the FED decides to cut rates or some other significant policy action prolongs the Intermediate (B) wave, then the path above - while not required - is still viable. Again, it is possible we have, in fact, topped where the chart shows "Or Top" at the label shown as minute ((a)). If so, it could have topped in either the Intermediate (B) wave, or Intermediate (5) of the Primary ((5)) ending diagonal shown in yesterday's post.

This chart, again, just allows more time for more divergence against the NYSE Advance-Decline line. Some of the uncertainty is due to the following: none of us has really experienced live-and-in-person, an extended fifth wave in stocks (except perhaps in 2000).  And none of us would have the experience dealing with an extended fifth primary wave in an extended fifth cycle wave. So, we don't know how much divergence with various indicators is needed.

So, we will keep an open mind. Thus far, the sell off has been somewhat orderly. Yes, there is a large gap in the futures chart from the overnight opening gap down. And, again, those tend to fill more quickly than the gaps in the cash market. But, depending on the magnitude of the move down that the market has in mind, we are going to be as flexible as can be. Today's advance-decline statistics on the NYSE were 271 to 1639, or about 1-to-6. While that is in the "impulsive" category, it doesn't quite make the 1-to-9, or 1-to-10 which often qualifies as a "kick-off".

As for today, the market closed with negative bias below the 18-day SMA, and the daily slow stochastic lost its embedded status. So, as far as I can tell, the swing line has turned down, and it is valid because the close is below the 18-day SMA.  You can find that chart at this LINK.

Have a good start to your evening.
TraderJoe

Saturday, January 25, 2020

A Fibonacci Time Relationship?

This is the second post this weekend. If you have not seen the first one, yet, you may wish to review it now.

Many readers of this blog followed the last time relationship we posted in that 2018 was a Fibonacci 89 years from 1929 since (1929 + 89 = 2018). The Fibonacci number 89 is the next number following 55 in the sequence 1,1,2,3,5,8,13,21,34,55,89... and is calculated by adding 34 + 55 = 89. The largest correction in the bull market to that point in time occurred in October of 2018. This was a top-to-top relationship, as 1929 was a top, and 2018 was too.

Another Fibonacci time relationship may exist in the chart below. I have not seen this elsewhere and know of no-one else who has made us aware of it.

ES Futures - Monthly - Fibonacci Time

This relationship would also be a top-to-top relationship, as well, since 2007 was a very significant market top. The question now is, "do we, in fact, have the famous 'too-far-too-fast' signature of a contracting ending diagonal" - which up to this point in time has maintained it's length relationships. If so, then the Intermediate fifth wave (5) would clearly be the extended wave in the sequence, as it is longer in points than wave Intermediate (3) in this form. And this extended fifth wave would be contained within what is, itself, the extended fifth wave of cycle V.

This is not too make too much of one significant lower day. Many further price confirmations are needed. Still, fore-warned is fore-armed. The information is what the information is. The question is whether it will amount to a top, a near top, or even "the" top.

Another reason for liking this form of the end of the Cycle is that the NQ futures have more than surpassed a (B) = 1.618 x (A) relationship. That may not be fatal for an Intermediate (B) wave count, but it does pose a challenge to it. The ES futures have only marginally nicked slightly over the same point.

So, we will be cautious, but we will also be curious. We will inquire. We will ask the market questions and see what answers it helps provide.

Have an excellent rest of the weekend.
TraderJoe

Friday, January 24, 2020

Risk-Off Day

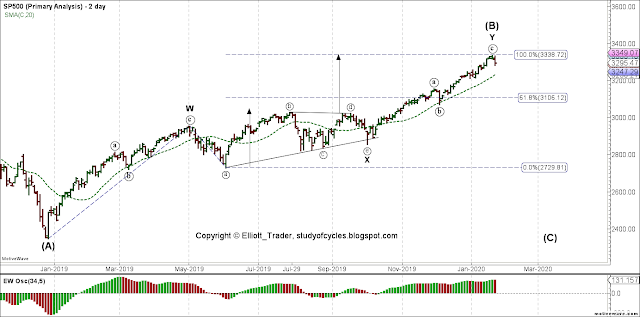
And it fits the Intermediate (B) wave count like a Fibonacci glove with Minor Y = Minor W, as in the two-day cash chart below when you use the lowest part of the triangle instead of the ((e)) wave.

S&P500 Cash Index - Two Day - Y = W

You'll also note that - in terms of "fit" - the usual expectation for a triangle target was met today. You take the widest width of the triangle and add it to the break-out point. The arrow on the right is just copied over from the one on the left. Picture perfect.

It's been a tortured, twisted, halting, grinding, count upward. I turned negative in the comments a couple of days ago. A bit too early. Or was it? Unfortunately, nothing about the long-term contracting ending diagonal scenario invalidated. The only difference is that you see wave ((a)) of Y as the extended first wave of the impulse for ((c)) of 5 of (5).

Probably because there is a little more room in the Cycle V diagonal count (shown in previous posts), the only thing that might convince me it was favored over the Intermediate (B) count, above, is a further higher high - to make five waves up.

Either count suggests a move down to the lows of Intermediate (A).

Here is how that last wave up ended from the Iran Tensions low on January 7th and 8th, as best we can tell since there is now a critical overlap in this chart. Either location you use for wave i results in overlap today, ruling out a further fourth wave location within this sequence.

ES Futures - 2 Hr - Divergence at the Highs

Right now our task is to count the downward wave as best we can. This is done using the ES 5-min chart, as below.

ES Futures - 5 Min - Five Waves Down

As best we can tell - using the principles of degree labeling - the third wave is the extended wave in the sequence. It is longer than i, or v. At this point the retrace wave looks sub-standard in terms of both time and price, so we may see more to that in the Monday session.

Have a great start to your weekend.
TraderJoe

Thursday, January 23, 2020

Three Down and Three Up (So far)

The best I could determine using either cash or futures is that price made three-waves down and three-waves up (so far). Here is the futures chart. The cash chart was repeated many times in yesterday's comments.

ES Futures - 30 Minutes - Three Down and Three Up

In this chart in the downward direction, c = 0.786 x a (to the pip), and in the upward direction the ((C)) or iii wave is 1.618 x ((A)) or i.

While such a pattern may start a diagonal lower, there is, as yet no conclusive proof of that. Such a pattern might also start a triangle that would lead to higher highs. There is still room to the upside, and there could also be down side surprises.

So patience is again the by-word. Now seems like the time for counting to see what larger form is materializing.

Have a great start to the evening.
TraderJoe

Wednesday, January 22, 2020

Repeat of Diagonal

For those who wish to see an Ending Diagonal to end the cycle, rather than an Intermediate (B) wave. This is a count I presented before. You can see that post at this LINK.

ES Futures - Weekly - Potential Diagonal

The major reason for liking this alternative is that the market sketched out two rather clear upper and lower trend lines shown. And the first retrace for Minor 2 is over 50%. Both the time and price length relationships are in the proper order: Wave 5 is < wave 3 < wave 1, and wave 4 < wave 2, and overlaps wave 1. Price would now be at the extended apex of the diagonal, which is often a turning point, and five waves up can be counted for the minute ((c)) wave of 5.

Price would now be in the throw-over of the diagonal, looking very much like it had "popped the cork" on a triangle or diagonal structure.

Again, there are some things not to like about this count, including a possible degree violation for Minor wave 2 and a slight truncation of the zigzag in wave 4. However, according to MotiveWave, no rules are broken in the count, and one would expect a fairly sharp reaction off of the high soon.

As far as I can tell, if you make the current high wave 3 of a larger diagonal it tends to remove those trend lines the market has already drawn. Again, as with any potential count, I'd like to see confirmation - beginning with first a daily reversal.

Have an excellent rest of the day.
TraderJoe

Tuesday, January 21, 2020

Temporary Simplification

Today was an interesting day. AAPL and the NQ futures made a higher high. The ES futures and cash S&P did not, but by just 0.25 - 0.50 points, an amazingly small margin. Also of interest, neither cash nor futures left a gap at the high. Still, we were able to follow the count downward in yesterday's comments, and you are welcome to review them at your leisure. The chart below of the ES 5-minute futures will simplify the short term picture.

ES Futures - 5 Min - Base Channel from the High

We have drawn a "base channel" around today's downward sloping waves. We caught the timing on a second wave very well; it is now longer in time than a first wave down (note, first and second can refer to a and b). Because this is such a short term chart, and there is insufficient information, we can not say that the downward waves are definitely i and ii, or a and b. For a third wave lower, there needs to be a 1.618 wave lower that breaks the lower boundary of the base channel, before there is a larger wave upward that breaks the channel upper boundary.

You can see that the setup is there. There may be a smaller degree .i first wave down following the wave ii / b high. As long as any upward price movement tonight remains in the channel, a downward count can remain in effect. Certainly so, if the base channel is broken lower. Very often, gaps down for third waves lower start in the overnight. Will that happen tonight? We don't know with certainty.

For that reason, we have placed a "wave counting stop" above 3,327 - which really is not all that far in points from the current price. Any movement above that level would likely indicate an incorrect count, and require counting like a sideways triangle or upward diagonal. But, we are not there yet, and it bears watching.

So have a good start to the evening and keep one eye on the overnight futures.
TraderJoe


Sunday, January 19, 2020

An APPLE a Day

"Uh. Tower. This is AAPL. We're approaching 1.618".

I know that a lot of people are interested in what I think the count in APPLE stock is. Here is the short term view on a two-day chart. I WANT you to remember something. Many, many wave analysts told me that the fifth wave up would form as an ending contracting diagonal. That is because APPLE stock was supposedly forming a diagonal. They were sure of it. I didn't see it happening at the location that they did.

So, here is the current local count on APPLE, as best I can tell. The rationale is below the chart.


APPLE, Inc. - Daily - Three Waves Up


There never was a diagonal in APPL. It would make an impossibly short B wave in terms of both price and time. There was a triangle; a "running triangle". It makes the B wave longer in 'time' than the A wave. So, lets get some measurements correct right off of the bat. Wave e of B overlaps A, as it is required to do in a running triangle. Within wave minor A, wave xi is the extended wave. Within wave minor C, wave xi is the extended wave. This wave is shorter in price and time than minor A which makes it a valid subwave of C. Within C wave, iii must be shorter than wave xi, so it must have ended already.

Price is approaching a perfect C = 1.618 x A. There should be a reaction off of that level.


Have a good rest of the weekend.
TraderJoe

Friday, January 17, 2020

Fractals ??

Does the chart below represent the hourly fractal of the larger fractal? If it does, I'll briefly mention the implication below.

ES Futures - Hourly Closes - Zigzag

This chart starts with the early morning of January 8th and the deep futures overnight dip to 3,180 on the tensions with Iran. When it seemed to abate, price rocketed higher in what I call a "no-pull-back A wave".  I did not have much trouble counting this wave as a diagonal. If so, it was Leading. But the wave can also be counted as an impulse. Because of the potential diagonal count, I thought it might have ended wave minuet (v), upward. That was incorrect. But, this wave was followed by a triangle. The running triangle was caught by reader Jack S. I did not catch it. I was working on, perhaps a larger diagonal. But, he did catch it. 

The triangle is followed by a ((C)) wave upward, which may or may not be complete yet. But, at least the ((C)) wave, up, starts with a wave that had a pull-back to back-test the upper triangle trend line. There is a nice divergence on the hourly MACD - but that's all it is at this point. Divergences can last a while. It's possible price wants to get a tad higher. That's OK with me either way. I'm in monitoring mode. So, where's the fractal? Here's the 2-day chart of the ES futures.

ES Futures - 2 Day - Fractal

As a Minor C wave, it has already passed its 62% extension on wave A. But, it, too, has a running triangle in the middle. That one I caught. This chart also started with an "event". It is the well-known announced turn-about in policy by the U.S. Federal Reserve to go into "patient mode" on raising rates and a decision to be flexible about normalizing its balance sheet.

Can this wave go higher? It can. It doesn't have to go much higher, but it can go to 100%. So here's the implication. If the hourly chart is making an ((A))-((B))-((C)), upward, that might start a diagonal wave or a large triangle that ends the sequence.

So, now it is a question of if I use this simpler description of the daily (two-day) up wave. In that case we may have A-B-C down to (A), and A-B-C up to (B). Let's take it step-by-step.

Have a good start to the weekend,
TraderJoe

Thursday, January 16, 2020

Exhaustion Gap?

Following on yesterday's post, we have been trying to count the minuet (v)th wave higher of the minute ((a)) wave. Here is the hourly cash S&P500. We may be getting very, very close as this morning's up gap 'may' be an exhaustion gap and there is critical overlap on the chart.

SP500 Cash Index - Hourly - Diagonal

Is the diagonal right in front of our eyes? Is that an exhaustion gap for wave v of (v) of ((a))? All of the price and time signatures would be correct in this form, and there is currently divergence with the EWO.

Have a good rest of the day.
TraderJoe

Wednesday, January 15, 2020

Getting very Narrow

ES Futures - Daily - Wedging

Have a good start to your evening.
TraderJoe

Tuesday, January 14, 2020

Interim Post

The market today is currently range-bound from the overnight highs. While we are waiting resolution, this chart shows the two most likely paths I can determine for price. If the market does wish to make the 3,300 high, then it could complete a larger hourly diagonal in the following manner.

ES Futures - Hourly - Diagonal or Start of (a) down as a Flat

If the market does make this alternate diagonal, then I will have called the minute ((a)) wave 15 - 30 points too early, and I will stand corrected. This count could agree with a slightly larger fifth wave in cash. If this diagonal pattern instead invalidates, then it is possible we have already started the minuet (a) wave down of the minute ((b)) wave down, as a Flat wave. In that case the wave i location is still the diagonal ending minute ((a)) wave, up.

We'll have to wait and see. Yesterday, the 10-day moving average of the put-to-call ratio took another dip, and is still solidly below 0.60 at 0.52.

Have a good start to the day.
TraderJoe

Sunday, January 12, 2020

More Evidence for a (B) Wave

This is the second post this weekend. If you have not already read the prior post, you are encouraged to do so, now.

Ok. I get it. People are getting 'darn tired' of all this (B) wave talk. They want something else. (B) waves are trying. They are "sucker" waves designed to get people bullish at exactly the wrong time. And nobody wants to be in that "got ya" category. (B) waves seem to grind incessantly. and never end. Still I must offer what I think is additional, not incontrovertible, evidence that we are, in fact, in the Intermediate (B) wave.

The first bit of evidence comes from the Monthly Russell 2000 chart, below. If you will study this chart from the 2009 low, you will see that there are five waves up with clear alternation.

Russell 2000 Futures - Monthly - x(5) wave

Do you accept the fact that there are five-waves-up with alternation from the 2009 low on this chart? And, by measurement, do you accept the fact that wave x(5) is, indeed, the extended wave in this sequence? And, by measurement, do you also accept the fact that there has, already, been a critical overlap on the chart? In other words, IF wave (3) was actually wave (1), then there would be an overlap that prevents the Dec 2018 low from being a new wave (4) location?

Further, if wave (5) is already the extended wave in the sequence, should the impulse go on further? Don't the extended fifth waves typically end the sequence?

If you easily accept what is on the chart, then why don't you also accept that we are in a "new" wave sequence that started with a three-wave-down sequence as Intermediate (A)? Has the chart gone over the top yet? Is it even at 90%, yet? No, in both cases. Is the Russell trying to make 90%? Maybe, but it does not have to.

OK. If that is not enough evidence, let's look at your money: your real money. More specifically, let's look at the S&P500 priced in terms of real money: Gold. The weekly chart is below.

$SPX:$GOLD - Weekly - Lower Highs

This chart attempts to do what many say is required: it tries to eliminate the effect of the FED's influence in the monetary system by pricing the S&P500 in terms of real money, or Gold.

When this is done, it is very, very clear that the all time high in the real valuation for stocks was in October, 2018 - at the high of wave Intermediate (5). Since that time, there has been a series of declining highs, although a lower low would be needed to more definitively prove the case. We think that will happen.

Again, it is the effort of this site to provide the evidence for the one - most probable - case for a count. The charts above add to the evidence. And this is in addition to the evidence provided by degree labeling. It is clearly up to the nay-sayers to make their case with their evidence that is hard to discount. We await such evidence.

Have a great rest of the weekend.
TraderJoe

Friday, January 10, 2020

A Long, Long Way from Home

S&P500 cash and ES futures made higher all time highs overnight or in the cash session today. They won't show up in the Daily Tracking chart below (which has the closes only). The tracking chart has had the prior projections removed to show a couple of points. Feel free to refer to past posts for earlier projections.


ES Futures - Daily Close - Versus Projection

One of the things that we wrote earlier was that if wave (ii) was less than a 38% retrace - which it was - then the upward wave, minute ((a)) should appear in a wedge. In this form, with the channel removed and actual trend lines drawn, you can see that those trend lines do converge and a wedge is formed.

Secondly, we think today is the top of the minute ((a)) wave. Why? Because we have been counting a diagonal upward in the futures since the 3,180 overnight low on January 7th. We can only count that the diagonal completed in the overnight. You can refer to the chart below.

ES Futures - 30 Minute - Diagonal Completed

The market pushed that diagonal to it's absolute limit. The measured limit for wave ((5)) was 3,287.75 and the actual overnight high was 3,287.00 - a difference of three ticks! None-the-less using the principles of degree labeling, we can not label the wave any other way. The clear over-throw of the ((5))th wave can be seen, and wave ((4)) has been exceeded lower in less time than wave ((5)) took to build.

So, now we have a diagonal to a top, and the question is, "will it be an ending diagonal?". And that's what the title, "A Long, Long Way from Home" refers to. By the principles of degree analysis, we can see that today is the longest and largest downturn since the upward diagonal began. So, somehow the degree has turned. But there is no concrete confirmation that the minute ((b)) wave has begun in earnest until that 3,180 level is exceeded lower.

Just for grins - if you have time - you should see where the CBOE Equity Put-Call Ratio has been in the last several days. I have showed you this chart many, many times before. Prices have been traveling in the Zone of Speculation for many days now, with the 10-day moving average the lowest in two years!

CBOE Equity Put-Call Ratio - Daily - Solidly in Zone of Speculation

And, it is also worth while having a look at the CNN Fear and Greed Index, which - to save space - we will just refer you to this LINK. The chart of interest is at the bottom of the page. Look at the latest readings a few days ago: the highest greed ever seen since the index began!

Readers of the blog comments earlier know that, today, we have two waves down with a 1.618 relationship in the form of what 'may' begin an expanding diagonal. Such a pattern must complete properly, but they hemmed and they hawed after that employment report today, and finally took out some important levels near the close. See my comments from yesterday, if interested.

Have a good start to your weekend!
TraderJoe

P.S. This chart was added after the post was made, and answers a question posed by a reader, below.

DJIA - Daily - Ending Expanding Diagonal

Note that the chart in the book started with January 1980. You have to go back just a few months to place the structure in its true context. If you do that, you'll find all the right lengths in terms of both price and time with (v) > (iii) > (i) in both. Note there is a tiny little truncation (*) in the fifth wave of c of (v) which would be considered perfectly normal after such a large structure and diagonal at that.

Thursday, January 9, 2020

New all time High - 2

Here is the continuation of the daily tracking post. The market made another high today, extending slightly the potential fifth wave of minuet (v) of minute ((a)), but also helping to make it look more proportional.

ES Futures - Daily - Higher High

Yesterday, a number of ways the wave count could continue were outlined. Overnight and during the day there was overlap upon overlap upon overlap. The resulting shorter-term count is the one below.

ES Futures - 30 Minutes - Multiple Overlaps

The 'b' wave count was eliminated as it would be longer in time than ((1)). That currently leaves a five-wave structure like a diagonal. The measurements are right for a diagonal, but just barely. Let's see how it goes.

A reminder that the monthly jobs report is tomorrow morning. 

Have a very good start to your evening.
TraderJoe

Wednesday, January 8, 2020

New all time High

Below is the daily tracking graph. A new ES futures low was made in the overnight, and then prices swung around 180 degrees to initially make a marginal new all-time high.

ES Futures - Daily - New ATH

The new ATH confirms at least the onset of wave (v). Could it be all of it? Yes, but then it would look quite short. The fifteen minute futures chart is below as it was counted in real time from the low.

ES Futures - 15 Minutes - From the Overnight Low

First, the overnight low did retrace 38 - 50% of wave minuet (iii), and better located the low for minuet wave (iv) of minute ((a)). And that's where the fun begins. Using the 0 - 2 trend line technique, we located wave ((3)), and called wave ((5)) in real time to the bar. But the tiny wave that follows (before the Presidential news conference at noon) really did not provide hardly any time to correct the first five waves up. Therefore we have either one of these four cases.
  1. Five waves up to the high
  2. Three waves up to a marginal high as a-b-c of a diagonal i wave of minuet (v) of minute ((a)).
  3. One wave up and making a big FLAT for a second wave.
  4. Three waves up and a non-overlapping fourth
The decline at the end of the day was the largest decline since the up wave began, so there is likely a degree change there of some type - even if just for a fourth wave. The shape of the upward wave is very funky, and the market is doing it's best to keep it's options open. If there is overlap in the overnight, it will help clarify the structure. Let's see what we can see tonight.

Have an excellent start to the evening.
TraderJoe

Tuesday, January 7, 2020

Tracking

At the first of the new year, I decided to post this potential topping scenario and it's close alternate - based on a potential ending diagonal wave to help burn off the new highs in the advance/decline line. The blue line is the actual. The red line is the projected. Click on the chart to enlarge it to see how it's tracking. Because it speaks for itself, I will have little commentary.

ES Futures - Daily - Projected versus Actual

I will say that so far price is under-performing a bit, which is interesting. But, at this time I do think wave minuet (iii) of minute ((a)) is completed, and we are now in minuet (iv). 

The alternate for the count is that Intermediate (B) finishes at the first high, where shown. In the alternate, the ((a)), ((b)), ((c)) would be completed since the October, 2019 low. Since the ultimate price differences are not that great, the main difference is in terms of time and the number of roller-coaster rides required.

Reader Pedro asked me to post a chart of the rise from 2009 to 2020, using The Eight Fold Path Method. Instead of a monthly chart, a three-weekly chart is used to provide the correct number of candles, in this case 167 which is the best fit for 120 - 160 candles.

S&P500 Cash Index - 3 Week - The Eight Fold Path Method

Nothing is changed in this chart. Both waves Intermediate (2) and (4) are clearly identified on the EWO by their respective approaches to the 0 line. If we assume that the higher high for the EWO is a third wave, then so be it. Wave (3) crests at the 1.618 extension in a contracting ending diagonal - both of which were called in real time. Within Intermediate (3) The divergence of Minor 5 from Minor 3 is clearly shown on the EWO. The same occurs in Intermediate (5), and is shown on the chart. The new wave (5) does not crest above the log channel as the third wave does, and this might be its primary tell-tale of any weakness.

The difference in the EWO for this chart is that the fifth wave doesn't diverge, right? Everyone has noted it. I am currently attributing it to this wave being the end of Minor 5, of Intermediate (5) of Primary ((5)) of Cycle V. Cycle V is currently the extended cycle wave in the sequence. Some fifth wave extensions that can be observed do not end on the expected divergence, like the 3rd wave extension shown in the example in the Featured Post does.

So now the market has higher highs and I can tell people are very uncomfortable with it. They don't like B waves, in general, and find them hard to handle. All I can say is, "look the at B wave for Intermediate (2). It's a very similar scenario - on a larger scale".

Note that in Minor B of Intermediate (2), the EWO also makes a higher high than wave Minor 3 - not shown for lack of room - of Intermediate (1). It's all a matter of degree and scale. Again, I think if you try to make the May, 2015 top Intermediate (1), then there is a huge new problem: an Intermediate wave would become larger than the size of Primary ((4)) at the 2009 low, and that seems like it would be bad form again. I could be wrong about that - and will be open minded. But at this point it seems highly, highly unlikely that a three-month down wave into December 2018 would correct a 10-year bull market. Wave Intermediate (2) was even much longer than that.

Have a good start to the evening.
TraderJoe


Monday, January 6, 2020

Call It Like They Measure - End of the Cycle

From what I can see, the potential diagonal scenario sketched out yesterday DOES shift the degree labeling problem to the upward waves. Those upward waves or their internals do become too long for their respective degree definitions. Please see the prior post if unfamiliar with the potential diagonal scenario.

And, if one tries to make an even larger upward diagonal, the problem gets even worse. 

Conclusion: The Primary and Cycle Waves upward have ended. The downward Intermediate (A) wave, and upward Intermediate (B) wave are correct. Any travel of Intermediate (C) that breaks the lower edge of the second blue box becomes Primary ((A)) down.

It is especially important to note in the Dow chart below where Minor 3 of Intermediate (5) ends. As a minor wave  - if labeled at the December 2017, top - it would become longer than the prior upward Intermediate Wave (3) - which is not allowed. As a large expanded flat Minor 4 provides alternation with Minor 2, and the waves retain their degree definitions. The 'net distance traveled' in wave 4 and 2, is thus made much more similar.

DJIA Cash Index - Monthly - End of the Cycle


In short, we said in yesterday's post that the waves in the diagonal proposal had to be verified in terms of degree. We simply could not in all good conscience find a way to do that. As a minor 2 wave, the Dec 24th (2018) low is not too long for the prior longest Intermediate wave, but it is too long for those prior Intermediate degree waves which are most proximal.

Therefore, the main count remains as it is. The degree has turned.

Both Primary ((5)) and the Cycle is over, as best I can tell. They ended at the October, 2018 high. Again, any movement of the Intermediate (C) wave below the trend line and the blue box is confirmation that Primary ((A)) of the next Cycle wave is underway. That is because the downward wave would become larger than the largest preceding Intermediate wave and must therefore become a Primary wave - a wave of one larger degree.

Best wishes to all.
TraderJoe

Sunday, January 5, 2020

Degrees - And An Unseen Diagonal

Over the weekend, I was reading, and re-reading, and re-reading the latest newsletter from a major Elliott Wave service. And in that newsletter I found that the author, Robert Prechter, has apparently gotten the internal degree labeling correct from the 1932 stock market low. The article also goes on to make a case that the level of 28,600 - 28,700 corresponds very closely to a Fibonacci number in the Dow. It is a very cogent argument. But, then the author goes on to make a case for a fourth and a fifth wave that completely destroys the degree labeling shown beautifully before. In short, it contains a supposed downward minute wave (a) of a triangle that is much longer in price and time than a larger degree minor W wave, also downward. Those of you that have been following the degree labeling details here know just what bad form that is.

My brain was working on over-drive. Is there an alternative to the one Prechter presents, that 'might' work, and still give us the fifth wave? I promise, the work below is wholly original. It sprang up from the question, "what if the whole dang thing is a diagonal?!" You have a look. I have seen this exact pattern nowhere else.

YM Futures - Weekly - Ending Diagonal ?

Wave Minor 5 is shorter in price and time than wave Minor 3, and Wave Minor 3 is shorter in price and time than Wave Minor 1. Wave 4 is shorter in price and time than Minor 2, and overlaps wave Minor 1. Wave 2 is almost a 50% retrace on wave 1 - which is even better proportions than the 2015 diagonal. And each of the three-wave zigzags has been labeled.

And, we would now be in the overthrow of a diagonal now, and nearing the very end of the diagonal wedge.

Here's what I know. I know that this count works at Primary degree. I know it works internally. In other words - Minor 2 is larger than minute (b), and minute (b) is larger than minuet ii. What I don't yet know is whether the wave works on a percentage basis from the 2009, low. 

Right now, the pattern is intriguing. In the spirit of Elliott Wave work, I encourage you to beat it up. Help me find what is wrong with it.

Have a great rest of the weekend.
TraderJoe

P.S. Subsequent to this post, I ran this idea through MotiveWave software to look for any 'obvious' errors. The good news is no blatant errors or warnings of any type were provided. The MotiveWave chart is below.

YM Futures - Weekly - MotiveWave Version of potential Diagonal

While it should be noted that the chart contains no errors or warnings, it must still be percentage verified. However, it is worth nothing that the Dow's "orphan wave" in Jan - Feb 2016 versus the S&P500 does get accounted for. The count remains an alternate pending further study and post-pattern behavior verification. This is only one step in a validation, and one further slight high is allowed.

Saturday, January 4, 2020

Weekly Doji

The weekly candle is a Doji which may also be seen as a weekly outside key reversal candle. The Doji occurred at a confluence of Fibonacci levels. But it would require a weekly confirming candle with a significantly lower close. The Fibonacci levels being noted are the 150% External Retrace of Intermediate (A) at the 3,262 level, and the Minor Y = 0.618 x Minor W, extension located at 3,253. Both levels are shown on the weekly chart below. The weekly count has not changed.


ES Futures - Weekly - Doji at Price Levels

The daily technical position is mixed and is somewhat in opposition as the Daily Slow Stochastic is still embedded, and the price bias is still positive with price closing over the 18-day SMA. The daily swing-line indicator just went to 'neutral' because of the recent lower low which follows a higher high. The daily chart 'also' shows an outside key reversal bar, as well

ES Futures - Daily - Outside Key Reversal

Daily prices are still in an up channel. And, while a Minor Y wave of Intermediate (B) 'may' indeed be seen as completed here, that assessment conflicts with the $NYAD (NY Advance-Decline line) having made a recent all-time high. So, the up move since October 'may' just be minute ((a)) of Minor Y. Yet, a retrace to the lower Bollinger Band, and/or even the 100-day SMA is likely at any time. In our view it is also possible that minute ((a)) has one more higher high to make - but there is one way to count the up wave in which it may not be required.

Have an excellent start to the weekend.
TraderJoe

Friday, January 3, 2020

Will it Or Won't It?

Here is what The Eight Fold Path Method - on the four-hour ES futures has to say about yesterday's up wave, and this morning's overnight down wave.

ES Futures - 4 Hr - Completed Wave Set

We have posted this chart many times before. It is nothing new. With now more than 125 candles on the chart (well within the recommended 120 - 160), the Elliott Wave Oscillator went below the zero line, then above the zero line on a divergence. The subsequent overnight action has gone below the prior wave ((4)) in less time than that wave took to build, and so our interpretation is that this wave set is completed.  

Per the New Year's Projection, below, these two waves were entirely anticipated. These waves would be (iii) and (iv) in the projection, below.

ES Futures - Daily Close - Projected

If the market is to finish an impulse, then a further higher high should be made. If a higher high (or a very good attempt at it) is not made, and the channel starts breaking down and being successfully back-tested, prematurely, then we may conclude that Y and, possibly, Intermediate (B) ended with Thursday's high. Then (i) = ((a)), and (ii) = ((b)), and (iii) = ((c)).

So far, the only thing odd about an impulse is that if (ii) is actually minuet (ii) and not minute ((b)) is that the up wave should have formed a wedge and not a channel. That is because the wave labeled (ii) is only a 23.6% retrace.

We will remain flexible, patient and calm until a more complete picture emerges. Stay tuned.
TraderJoe

Wednesday, January 1, 2020

New Year's Speculation

Here is an idea for you - as long as you accept it for only that. It is not to be taken as trading or investment advice. While this idea might seem either overly precise or overly complicated, it is based on the Elliott Wave principles listed below the projection/speculation. One way to look at this is that I do it at my own risk. Another way to look at it is that a person needs to have a potential idea for what could occur, and monitor deviations from the expected. So, without further delay ...

ES Futures - Daily Close - Projection/Speculation

Here are the principles involved in this chart. The chart starts with the current up wave from October 2019. Actual prices in blue continue through the end of December, and the projection follows in red.
  1. The Federal Reserve is still very active in the markets.
  2. The NY Advance-Decline line is still at an all time high.
  3. The most prominent structure in 2019 was a mid-year triangle.
  4. There should not be a diagonal immediately following a large triangle, by alternation.
  5. Therefore, the current up wave from October should resolve as an impulse.
  6. The current impulse should end minute ((a)) of Minor Y of (B) in January.
  7. There should be a 38 - 62% move down from the high for minute ((b)).
  8. Once the minute ((b)) is made, then, a minute ((c)) wave could be a diagonal, as ((a)) and ((c)) would alternate.
  9. For the diagonal, each of waves (i), (iii) and (v) should marginally exceed the prior high.

A diagonal structure would help maintain the 1.50 or 1.62 extension of Intermediate (B) on Intermediate (A). The three higher peaks of the diagonal would be around March 1, April 1 and May 1, or the employment reports those months.

Notice in the current up wave from October, we have not seen a triangle wave or a diagonal, yet. Typically, one of these two patterns precedes a major top. The diagonal should have good proportions within it. Three waves in each numbered leg should be pretty distinct, and the retrace percents within the diagonal should be substantial. The hardest thing to project will be the depth and shape of the minute ((b)) wave - if it should occur.

Have an excellent start to the New Year. Please don't blame me if the chart doesn't work out day-by-day. It is the best projection I can do, given the Elliott Wave principles available, and incorporating stock market seasonality.

Have a very good start to the New Year.
TraderJoe