Market Indexes: Major U.S. Equity Indexes closed lower;
SPX Candle: Lower High, Lower Low, Lower Close - Trend Candle
FED Posture: Quantitative Tightening (QT)
Yesterday, we wrote about the c Failure wave for a possible minuet wave (ii). We had showed those who had looked at the post script written about the potential diagonal ending diagonal c wave, and said to confirm it, it must exceed the start of the diagonal in less time than the diagonal took to build. It did that today. The chart is below.
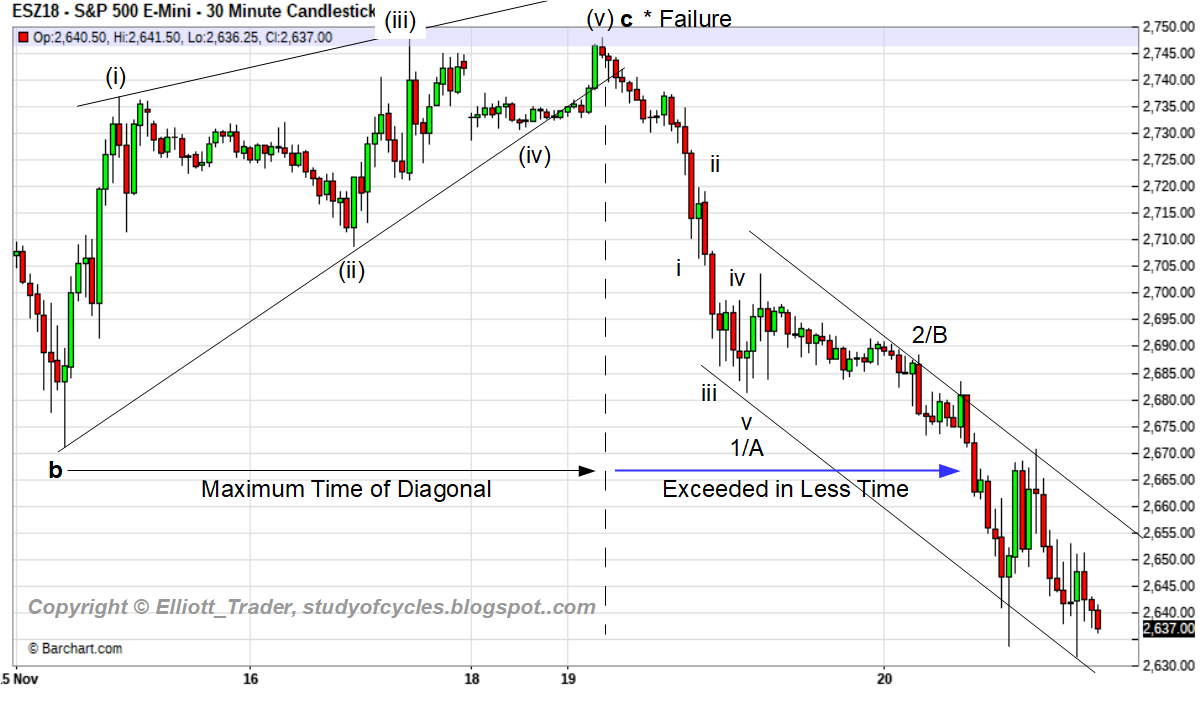 |
| ES E-Mini S&P500 Index Futures - 30 Minute Chart - Ending Diagonal Confimration |
The diagonal failure is clearly labeled. Further, you can see that the time of the blue arrow is less than the time of the diagonal. We said yesterday, the overnight waves were part of the diagonal - part of the previous trend. And, we counted the five waves down (shown as i - v, above) to a larger wave, shown as 1/A in this case.
So, the diagonal was confirmed as an ending diagonal, and prices continued to sink. The sideways wave now looks suspiciously likely a triangle, and 'could be' a B wave. If so, it is part of an A,B,C down wave for a wave of the larger flat we discussed over the weekend (see the post at this LINK). If not, it is part of an impulse lower.
Price has not exceeded the upper channel line yet. Price is now 100 points lower than when I suggested the c wave up might have ended. This is in distinct contrast to another site that said that they were expecting prices to hit 2,815 or possibly 2,880. <Gulp>. Wrong again at another significant turning point.
Whether minuet (iii) of minute ((iii)) is forming, or the larger flat is forming will be determined in the next couple of days. Right now, as best I can tell, price is not yet at the 90% level needed for the flat.
For now, as long as price remains in the channel, lower, or breaches it only by a partial bar, then one should still consider prices may be headed lower. If they break the resistance of the upper channel line by two full bars or more, then an up trend may be resuming.
Have a good start to your evening, and a good holiday.
TraderJoe
Thanks again Joe. I endured a bit of ridicule when I mentioned the possibility of an ending diagonal a few days ago and while I was expecting to see a throw-over, I fortunately got positioned early!
ReplyDeleteI deeply appreciate your emphasis on LEARNING EW, instead of always looking to others to gain insight on what is unfolding, and would like your permission to share your charts with others trying to master the method. If that is not O.K I will understand and simply direct them to the blog. I did your your hint about the time factor in determining the validity of the ED but was glad I got positioned on the earlier break of the lower boundary with a stop at the high.
Thanks again for all your do and enjoy your Thanksgiving holiday.
Hi Verne. Please direct any interested person to the blog. The charts are copy- righted and I am not providing my permission to retransmit them.
DeleteJoe,
ReplyDeleteYou are magic!!! thanks for sharing.
Welcome David
DeleteET,
ReplyDeleteYou said "suspiciously likely a triangle", wouldn't you expect volume to have been lower?
The B wave triangle would have largely been overnight. That would seem to be quite low volume.
DeleteThank you for clarifying. I'm enjoying my book by Constance's Brown. I found this pdf of her Composite index, studying it now.
DeleteHave a good Thanksgiving!
Thanks Joe. SPX CASH has left me with more questions since W2 was not very well formed (in hindsight, it appears it could be an ABC with diagonal C). Not asking you to diagram CASH. My question is this:
ReplyDeleteIs it times like these that you look to ES / Futures for more context? or are you always reconciling the two?
There is an old trader's expression, "futures lead but cash is king".
DeleteThanks Joe for your objective view of the charts, much appreciated. Great work.
ReplyDeleteThx Berg.
DeleteThanks Joe for your awesomeness. It appears you are a God that speaks to us through EW. When do you expect the W3 to bottom out based on your estimation...2021?
ReplyDeleteHi Jay. I prefer to keep the very long range projections at bay right now. I'll have more on it later.
DeleteJoe, any reason this can just be a plain ole zig-zag instead of a flat. We don't need to get to the 90% level after all. And we can start the C to over 2800 from here.
ReplyDeleteNope. That would have to be a double-zz.
DeleteJoe,
ReplyDeleteHappy Thanksgiving!!!
You, too. David!
DeleteHi Joe,
ReplyDeleteI have my best trading year by reading and learning form your posts.
Many many thanks.
Again you have a wonderful Thanksgiving and weekend.
- David
Good deal. You as well!
DeleteMore than 2 bars out of the channel in ES. It looks a lateral (corrective?) movement though
ReplyDeleteCould still be a fourth wave triangle.
DeleteJoe, do u think we are seeing so many triangles because of distribution?
ReplyDeletePartly, yes. The big boys need a way to get out without dropping prices too far.
DeleteJoe, ahead of Thanksgiving, I just want to say that I'm grateful for the fact that your method is to teach, rather that do the work for us. I hope your Thanksgiving is plentiful and good. Thanks!
ReplyDeleteWelcome & happy Turkey day!
DeleteA fourth wave Flat is still OK from here, but I'm letting the market 'prove' that count to me with lower bars and a retrace that holds the latest high first.
ReplyDeletejoe best to you and your family
ReplyDeletehappy thanksgiving
Thanks Marc: to you and yours as well!
DeleteEWO for a wave 3 (S&P500 10m chart) is at -39.7. Maximum allowable for a wave 4 would be 15.9 (40%). Actual maximum EWO is at 15.4. Flat confirmed?
ReplyDeleteHave a good Thanksgiving! Edgar.
Whether the flat occurs or not, good work! And isn't it great to have some decision tools?
DeleteHi, Joe, so this is the wave 4, does that mean we will test the 2630s area again in wave 5 and then go for wave c which can be up to 2780 area? thanks
ReplyDeletePls see the Thanksgiving Day post.
DeleteAlso, happy thanks giving day for your all year great works, thanks
ReplyDeleteThanks. Happy Thanksgiving too!
Delete