Friday, August 30, 2019

Inverted Hammer

U.S. Debt Clock: $22.55 Trillion
ES Daily Candle: Higher High, Higher Low, Lower Close: Inverted Hammer Candle
Market Posture: Neutral and Probing Waves
Daily Swing Line: Up (Higher Low, Higher High)
Daily Bias: Up (Settle Over 18-day SMA)

The wave labels have been left off of the daily chart, below, for a reason. They will be published in a weekend video. Today's candle is called a weak inverted hammer because it did not close clearly red. As with most candle-stick patterns a confirming daily lower close candle is needed to suggest the end of an upward count.

ES - Daily - Inverted Hammer

Prices traded much higher in the evening. They tried to hit the upper daily Bollinger Band, but did not. We were able to count a completed impulse, upward from the August 28th low. (See yesterday's comments). Then prices traded all the way back down to tag the 100-day SMA before bouncing into the close. As you can see from the Fibonacci ruler on the side, prices briefly traded above the 62% retracement level, and then closed below it. From the August 26th low, one can count three-waves up.

The daily Bollinger Bands are traveling sideways at this time, and the daily slow stochastic is currently in over-bought territory. I hope to have more for you later in the weekend.

For now, have a good start to your weekend, and/or holiday!
TraderJoe

Thursday, August 29, 2019

How Good Counting Adds Flexibility

U.S. Debt Clock: $22.55 Trillion
ES Daily Candle: Higher High, Higher Low, Higher Close: Trend Candle
Market Posture: Neutral and Probing Waves
Daily Swing Line: Up (Higher Low, Higher High)
Daily Bias: Up (Settle Over 18-day SMA)

Yesterday, we counted out an exacting diagonal on the five-minute chart. We did not call it an ending diagonal for a reason. Near the center of a chart such a structure can wind up being a leading diagonal. And, as the ES 15-minute chart, below, shows, it was! Recognizing that fact can help prevent some big mistakes.

ES 15-Minute - Position of Yesterday's Diagonal was Leading

It is nice to have an example to show particularly those newer to Elliott Wave, that not all diagonals are the "death knell" they often hear that they are. Sometimes, instead - as in this case - they are "the wind up before the pitch" or the leading variety of diagonal. Remember that leading diagonals may only be in the 1 or A wave positions on a chart.

Today was a powerful third wave that followed the diagonal. The chart above shows the market poised to make a fourth wave, but it hasn't yet. At today's ES settlement, with 119 candles on the chart - well within the recommended range of 120 to 160 from The Eight Fold Path Method - the Elliott Wave Oscillator is nearing the zero line again. Wave ((3)) of iii is on a peak of the EWO, and wave ((5)) of iii is on a divergence. So, right now, the wave fits an impulse, but it has not yet followed through with the needed form. If there is a drop in the overnight, or at least a running triangle followed by a fifth wave, then that fifth wave should occur on a divergence with the peak EWO.

Yesterday, I said if the market makes a higher high then it opens up several options. We have covered some of them before, but will I recap them in light of recent pricing on the weekend.  Again, it is not a problem so much in wave counting at this time as it is matching up the wave count to the money flows and news cycle here in the middle of the wave.

This is again a reminder that tomorrow is the last day of the trading month - with a propensity towards "window dressing" and some of the sloppiness that entails. Then, Monday/Tuesday will be the first trading days of the month with the likelihood of inflows from pension funds, 401k's, company bonuses, dividend reinvestment plans, etc. Oh, and  this first of the month will be the first of the month of September, which, in a study from 1950 to 2018, has the largest negative seasonality of any individual month overall. (Past performance is not necessarily predictive of future results.)

Have a good start to the evening - or to your long weekend if you are in the U.S. or otherwise celebrating the holiday or a vacation.

TraderJoe

Wednesday, August 28, 2019

An Exact Count with Two Interpretations

U.S. Debt Clock: $22.54 Trillion
ES Daily Candle: Higher High, Higher Low, Higher Close: Yin-Yang Candle
Market Posture: Neutral-to-Negative and Probing Waves
Daily Swing Line: Neutral (set up for either higher or lower)
Daily Bias: Down (Settle Under 18-day SMA) for fourth day

Today we counted upward this exacting diagonal structure on the ES five-minute chart and posted it in real time. First, here's the chart as it was shown at 03:22 PM ET today.

ES - 5 min - Diagonal

We chose  this count because any other would not respect the 0 - 2 trend line off the low. In other words, if you draw a line from 0 - b, it would cut off a third wave if you tried to call that the third wave. Also, in the futures - not in cash - there is an overlap with the down wave at 11:00 and what is labeled the a wave up. Then, in the after hours, price began to move lower after a near-equal retrace of the highs. But, it was enough to say that wave ((4)) can not be misplaced - because a downward wave would now be longer than wave ((2)) which is not allowed in a diagonal.

But, here's the problem: the very same wave structure can either be a leading diagonal or an ending diagonal! If it is an ending diagonal, then we proposed a plan for that in yesterday's comments. Let me provide a reminder.

ES - 2 Hr - Declining Trend Line Broke Upward

We said yesterday that for a wave ii location to be where it was shown, the dotted magenta trend line would have to hold. It did not. There's no "fudging it", no "only slightly over it". It just didn't hold plain and simple.

If there is a big gap down tonight (not saying there will be) and the low of alt: x is taken out, then we also posted that the downward structure could be a much larger diagonal which I sketched out in real time and you can find at this LINK.

But if the shorter-term diagonal is leading, then a number of upward counts is possible. Why such seeming indecision? It should be clear by now, it is not a problem with wave counting methodology. When a person can chart a wave to the 5-minute bar, then the method is pretty much spot on. No, as you can see from the chart, below, we are still doing battle at "the line in the sand", at the 18-day SMA, touching it again today. The Bollinger Bands are narrowing in. People are on vacation. We are in the middle of a price range. Pricing is both whippy and choppy.

ES - Daily - Close Near 18-day SMA

There is nothing sacred about a wave count when one recognizes the larger context. So, each day will be examined for what it is until there is some additional clarity.

Have a good start to your evening.
TraderJoe

Tuesday, August 27, 2019

Battle at the Line-in-the-Sand

U.S. Debt Clock: $22.54 Trillion
ES Daily Candle: Higher High, Higher Low, Lower Close: Neutral Candle
Market Posture: Neutral-to-Negative and Probing Waves
Daily Swing Line: Neutral (Lower Low, Higher High)
Daily Bias: Down (Settle Under 18-day SMA) for third day

First, let's finish with yesterday's chart for consistency. As anticipated, prices traded higher in the overnight, then opened higher this morning and traded marginally higher for about 30-minutes, then began to sell off.

ES - 120 Minutes - Second Wave


The up waves are best interpreted as an ((A)) wave, up, and a barrier triangle for a ((B)) wave - based on degree - followed by a ((C)) wave to the new high. After today's high, we counted five waves down in a channel, with good form, using The Eight-Fold Path Method. IF today's high is a second wave, then the dotted magenta line down from the previous high should hold. If the bottom is not exceeded relatively soon (days), then the best alternate is that a second wave might extend as a double zigzag, so a lower low below ((B)) that does not break the wave i low might only be an alternate x wave. But, right now, the EWO signature is that of a second wave, having retreated most of the way to the zero line.

Next, let's go back to the daily chart.

ES - Daily - Battle at the 18-Day

Prices briefly exceeded the 18-day SMA and tried valiantly to reach the 100-day SMA but could not do it. Then, they were turned down by the 18-day SMA as well, and closed lower. This is what was called "having a battle at the 18-day SMA". So far, the downside forces are winning a bit. The daily slow stochastic has turned lower, and as long as that remains the case - from a wave counting view - it should be respected.

Have a good start to the evening.
TraderJoe


Monday, August 26, 2019

Nothing Broke

U.S. Debt Clock: $22.54 Trillion
ES Daily Candle: Lower High, Lower Low, Higher Close: Neutral Candle
Market Posture: Neutral-to-Negative and Probing Waves
Daily Swing Line: Lower (Lower High, Lower Low)
Daily Bias: Down (Settle Under 18-day SMA)

While nothing "broke" by the rules today, let's fix it anyway. The cash S&P 500 index chart on the 15-minute basis really is no longer "looking" like a proportional fourth wave - even though it measures OK at the close.

And because of the overnight futures waves which keep being both 1) dramatic, and 2) invisible in the cash markets, it seems like this is the better downward count.

ES - 2 Hr - Diagonal and First Wave Down

Even at the ((A)) wave up this morning, the futures were very near the 62% retracement level. And, there are now more up bars to ii than down bars to i.

So, if the count is correct, then there is an Ending Diagonal at the high. I did call the truncation at the (c) wave on the 1-minute chart. But other readers of the blog suggested the ending diagonal - which is longer in time - and then a completed first wave down to last night's overnight low. I have suggested before that counting the cash market is getting to almost be a fruitless exercise. This is another example.

The main reason for showing this chart is that if there is a true ending diagonal at the high, then the low of the (b) wave must be taken out in less time than the diagonal took to form. And looking at brokerage quotes for the ES, it already has been - although you would never know it from the above chart! I did confirm it using a second source of reliable quotes before writing this post, but this is a real caution for those using the "free" tools: they have the potential to fake one out (even though they didn't me, this time).

So let's see how this goes: neutral, flexible, patient and probing.
Have a good start to the evening,
TraderJoe

Sunday, August 25, 2019

Weekend Video - Steps to Confirming an Impulse Wave

Here is a weekend video report than I hope some of you (particularly the less experienced at wave counting) will find useful. Again, to be respectful of your time and mine, the video has been limited to about four (4) minutes.


I might also note that a gap down on Sunday that back-fills on early Monday might be part of the b:3 wave of a flat. Let's see how it goes.

Thanks for watching and have a very good rest of the weekend.
TraderJoe

Friday, August 23, 2019

Powell Snores, China Roars

U.S. Debt Clock: $22.53 Trillion
S&P500 Candle: Lower High, Lower Low: Trend Candle
Market Posture: Neutral-to-Negative and Probing Waves
Swing Line: Neutral (Higher High, Lower Low)
Bias: Down

If FED Chairman Powell's speech at Jackson Hole was meant to inspire today, it certainly didn't. Steve Leisman from CNBC almost fell asleep summarizing it. That, and some announced retaliation by China in terms of tariffs, sent the market reeling today. Price broke through the 100-day SMA and then the 18-day SMA and kept on going. In doing so, prices filled the futures gap (black circle at the arrow) we said could fill relatively quickly because futures gaps are just not as persistent as cash gaps. We will remove further reference to that gap from future charts.

ES - Daily - Lower Daily Low

While the swing line is confused, today we eliminated the alternate labels on the chart. A more than 2.618 wave was made in the downward direction on the cash 15-minute chart, and that means we should err on the side of a third wave. The bias of price is to the downside again, being below the moving averages. Further, if downside movement continues, the lower Bollinger Band would be a good initial target for the move. The moving averages have crossed over - as we noted yesterday - and today price is confirming the bear cross with lower prices.

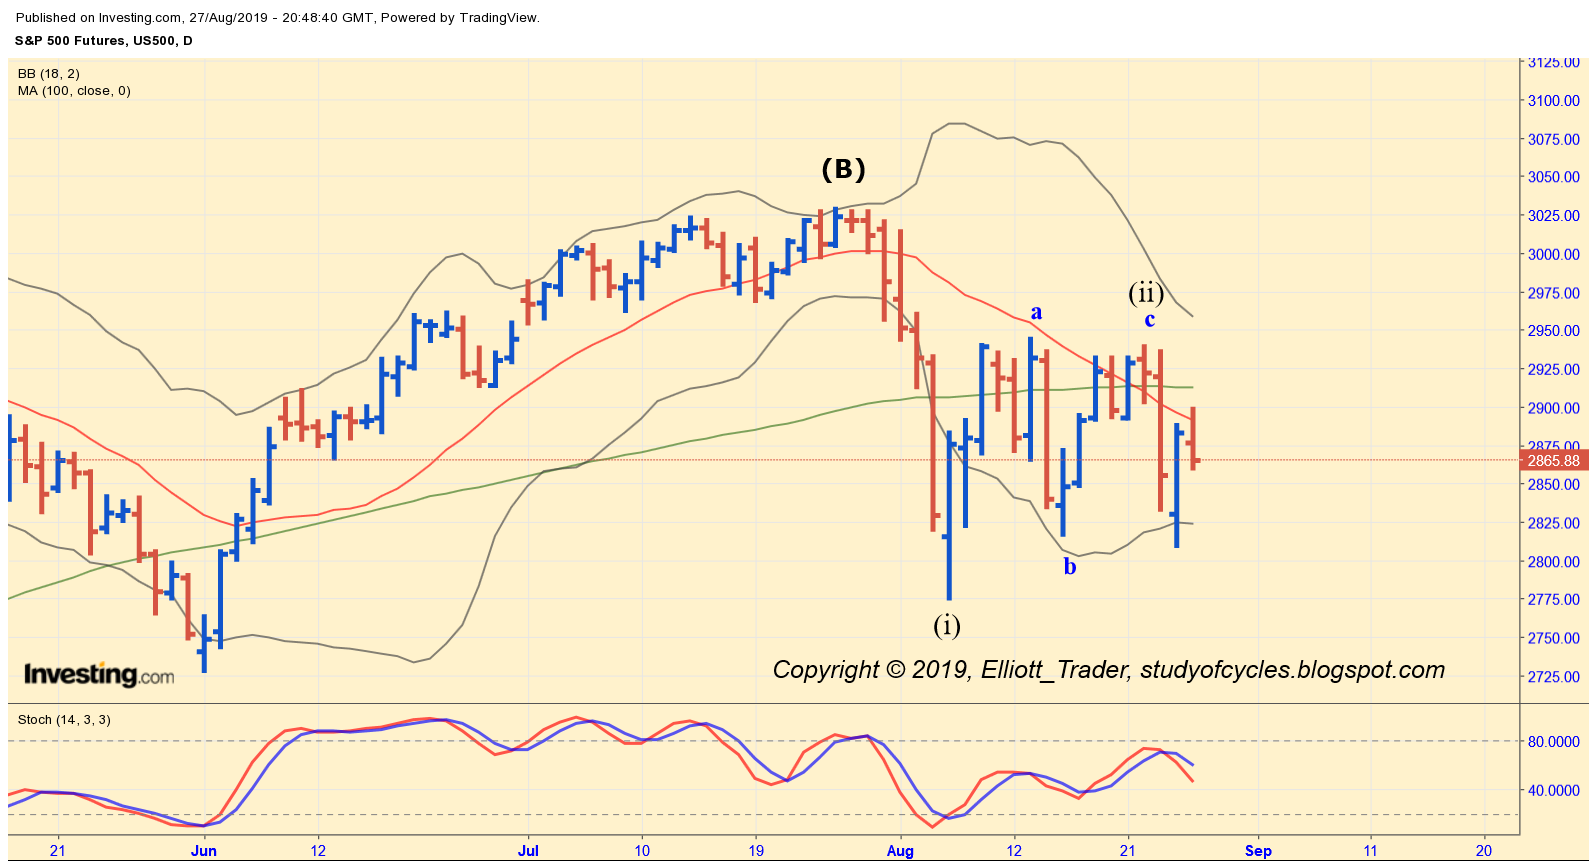
The w-x-y failed double zigzag also counts like a good example of a second wave. It found a barrier at the 62% retracement and simply was not able to penetrate it. It tried hard even into last night, still reflecting the caution in the count, but it could not do it. The second wave (ii) is also nicely longer in time than (i), and the Bollinger Bands are now crashing down below the prior high - which should give the bulls some pause. The daily slow stochastic was in over-bought territory and, although it has not rolled over as of the futures settlement, if it does, it would likely confirm the lower daily high.

Any price movement below the x wave would also provide more confirmation of a top. One final reminder: Art Cashin likes to say, "stocks rarely bottom on a Friday".

Have a good start to the weekend.
TraderJoe