Yesterday, I stated that the downward count remains "quite complex". I did that for reason. Few counting options were making sense on the S&P500 or the ES E-Mini S&P Futures.
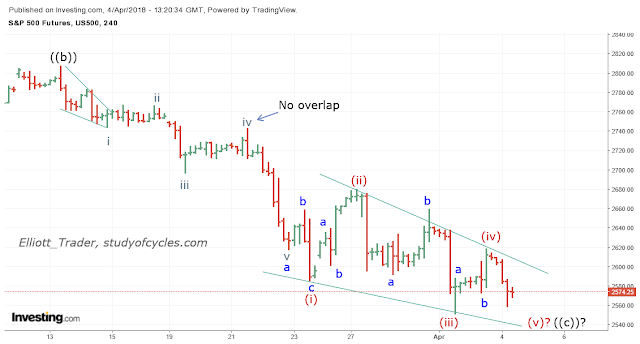
This morning, thanks to the overnight lower start to the futures, and two wave measurements, the count may have cleared up considerably. The count below needs one more lower low - or a serious attempt at it - to complete a potential diagonal minute ((c)) wave lower.
 |
| ES E-Mini S&P500 Index - 4 Hr Futures - Potential Diagonal |
The issue here is that I have been looking for a count that does not contain degree violations. The measurements that make this count possible are that within the first blue a, wave iii is longer than wave i, and wave iv does not overlap wave i, or encroach on wave ii price territory. Further, I was trying to apply what "looks like" obvious three-wave movements, and yet, get the "fives" correctly placed.
So, in this count, wave minuet (iv) would be shorter than minuet (ii), wave minuet (iii) would be shorter than minuet (i), wave minuet (iv) overlaps wave minuet (i), and, now, wave minuet (v) would be have to remain shorter than wave minuet (iii). Once again the Elliott wave process gives us a clear invalidation point!
If prices can make the lower low, and then pop up higher out of the wedge, and, then successfully back-test the wedge, a higher wave overall might then occur.
But, note this: in a contracting ending diagonal, it is acceptable for price to fail to just make that lower low.
Let's see how it goes. Have a good morning.
TraderJoe
Excellent observations TJ, thank you. Since this would have the S&P bottoming very near the early Feb low, would this be consistent with a Descending Triangle as detailed on pg 49 of EWP?
ReplyDeleteThanks again and best regards,
Andy