Wednesday, June 18, 2025

Three-Ways

You've heard of "Freeways", right? Where traffic is supposed to zoom along like I-15 to Las Vegas, right? Not like the "405" that crawls you down to a crunch stop on the way from LA to San Diego, right? Well, today's market, so far, in front of the Federal Reserve announcement, dot-plots, and press conference is more like the latter, but what I have termed temporarily "Three-Ways".

ES/SPY/CFD - 2 Hr - Three-wave Sequences Only

As of this morning anyways, the two-hourly ES/SPY/CFD has only three-wave sequences. And last night's up wave was longer than the immediately prior b wave. Further, note the downward c wave stopped around that 78.6% level which could indicate a triangle.

So, the bottom line is that highs or lows need to be broken to get out of this mess. A triangle is possible, overall. A downward diagonal is possible for the most recent wave. Fittingly, the front-month ES contract is only down to the 18-day SMA as of last night with the daily slow stochastic in over-bought condition only (not embedded) - and this is where it often goes in front of major announcements.

ES Sep Futures - Daily - Bounce from 18-day SMA

So, be careful as whippy conditions could prevail. Lots of valid Elliott Wave structures are valid from here, so it is more a case now of ruling out what becomes not possible - or less possible - based on price lengths made today. On the first 2-hr chart, one might especially watch the 78.6% upward level in the triangle eventuality, or the low of the c wave in the downward diagonal eventuality.

Have an excellent rest of the day.

TraderJoe

Monday, June 16, 2025

Cash to 90%+

After three-waves down we noted over the weekend, the SPY cash index went to the 90% level, plus some, as below. The current front month (June) ES contract did also. The roll-over contract went to the level of 1.236 times the down wave.


The ES price is still over the 18-day SMA. The bulls are still in control. That being the case, a (b) wave of a Flat, Expanding Flat, running Flat or of some of the kinds of triangles is still possible, but no conclusions are reached as of this time.

Have an excellent rest of the evening.

TraderJoe

Saturday, June 14, 2025

The Extended First Wave Count to Minor A - 3

On the daily chart not too much has changed with the recent hostilities. In terms of the wave count it remains the same, as below. Confidence has increased slightly because, over the last couple of days, a longer wave down has been made than the (e) wave of the triangle, and it traded below that level, as well. Since, triangles often precede the last move in a sequence, there is some greater level of confidence that a top is in place temporarily on the ES daily chart, below.

ES Futures - Daily - Minor A

This also means that the break of the wave ((ii))-to-((iv)) trend line (circle-ii to circle-iv) occurred in less time than wave ((v)), circle-v, took to build. Neely adherents will recognize this as the first step in the confirmation process. Trading below the (a) wave, and possibly filling the higher of the two open gaps would be a good second step.

We say - and we mean - confidence precisely because we are always just dealing with probabilities and odds. For example - at present - we only can legitimately count three-waves-down, so far, on the hourly chart shown below.

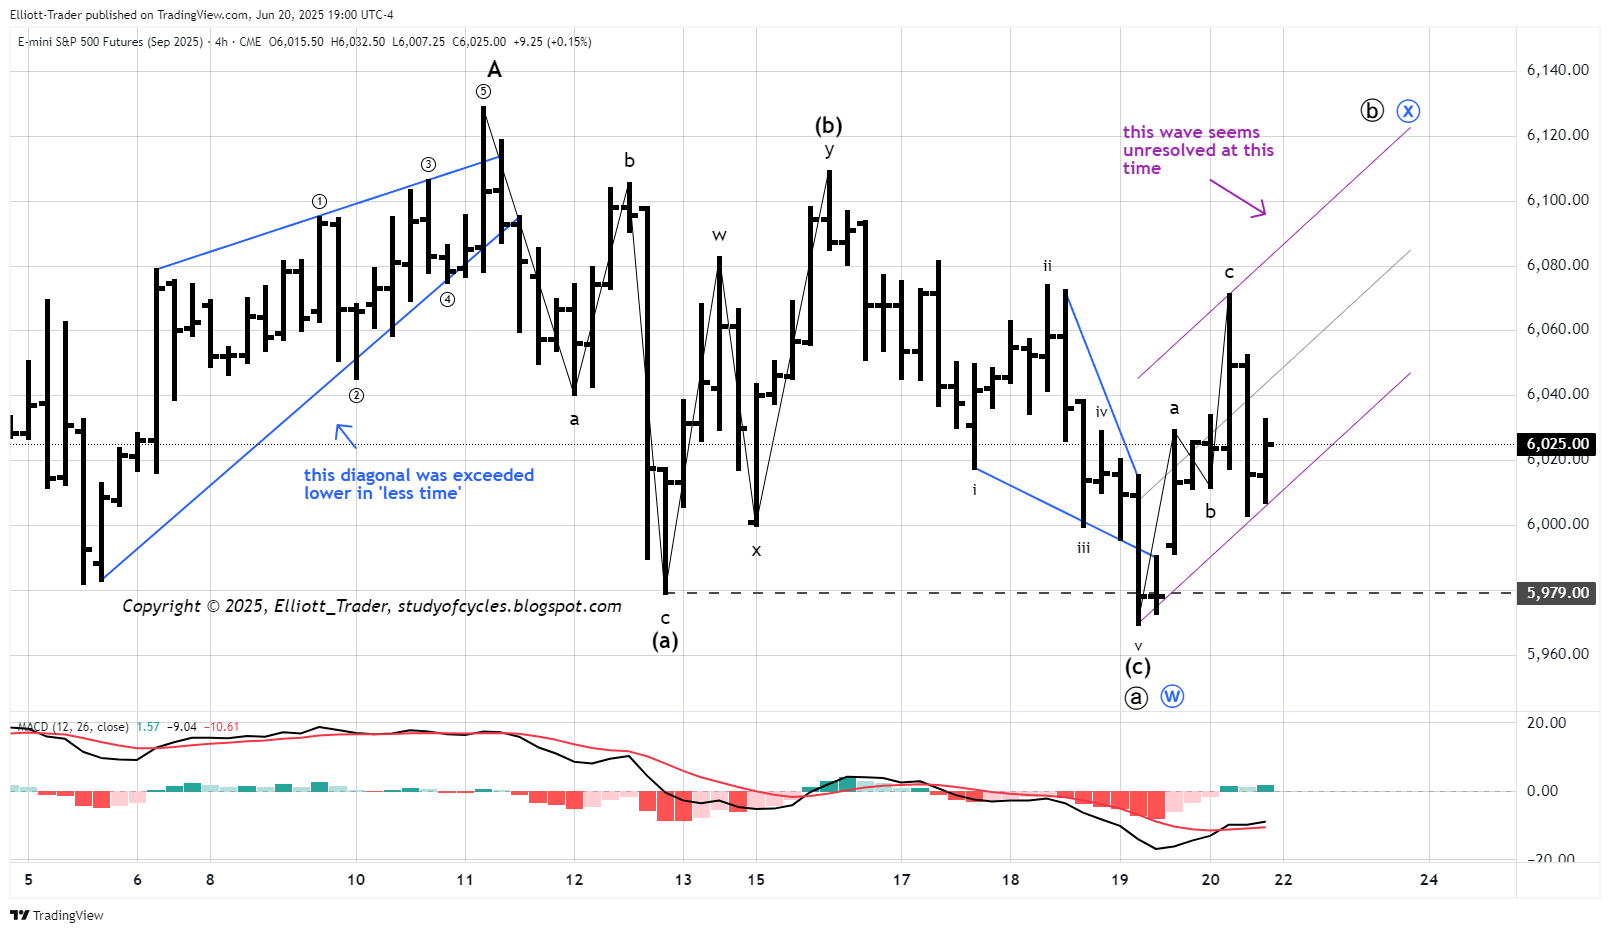
ES Futures - Hourly - Three Waves Down

Notice the very precise Fibonacci relationships where - at the b wave high - wave  = 2.618 x , and at the bottom wave c = 1.618 x a. Again, this just reinforces three-waves-down in the futures. Then, for the up wave, notice that it is longer in price than the b wave, up. Therefore, it is either of the same degree or one higher degree. At present, we are showing it as one higher degree. However, IF it is of the same degree, then it is possible a triangle is forming (we'll deal with than one if Friday's low is not exceeded lower).

Then, notice the Elliott Wave Oscillator (EWO or AO) is really only showing a significant trough, a hump above the zero line, and another lower significant trough. So, this looks like only a three-down, with a flat for the b wave.

This does not mean it can't start a diagonal lower, but lower lows are needed to prove that case. And if a diagonal forms, then the five minuette waves down, (i) through (v), would form minute  wave down, because it would take three minute waves, -- to form the minimum Minor B wave down.

The bottom line is more length in the Minor B wave is probably still necessary. Readers of this blog should also plot the daily Bollinger Bands with the 18-day SMA and daily slow stochastic to see that all we have been doing is "fighting the battle at the 'line-in-the-sand'." A close below that 18-day SMA is needed to be a more convincing onset to the correction. So, try not to rush the counts. There are only three-waves-down, so far. The bulls are technically still in control until they are not. Legitimately, the three-waves-down means travel over the top is still possible until / unless Friday's low is exceeded lower.

Have an excellent rest of the weekend.

TraderJoe


Tuesday, June 10, 2025

The Extended First Wave Count to Minor A - 2

The lack of progress on the Minor B wave downward despite overlap, after overlap, after overlap suggests that perhaps Minor A is still underway with a triangle for minute ((iv)), circle-iv, on the ES daily chart, below.


The remainder of the counting process and conclusions remains the same. Further, we do not know that upward movement is over.

Have a good start to the evening,

TraderJoe

Saturday, June 7, 2025

The Extended First Wave Count to Minor A

The concept of this chart has not changed since it was originally published on May 29 at this LINK. It is still The Extended First Wave Count to Minor A. It is now out to 130 candles, and it is still the count that 'best' meets the rules and guidelines of the wave principle, and which follows The Eight-Fold-Path Method for Counting an Impulse Wave. The ES 8-hr chart is below. Please remember that double parenthesis, i.e. (( )) is the same in text as a circle, for minute waves. Thus, in text ((i)) =  and so forth. With that in mind we have added some recent details.


In the extended first wave count, then, wave ((v)) < ((iii)) < ((i)). Notice wave ((iv)) is actually somewhat longer in price than wave ((ii)) but does not overlap wave ((i)). This is likely a key that the count is correct because the two waves, ((ii)) and ((iv)), should be of the same degree - or else ((iv)) is of one higher degree, since it is longer. My contention is that they are of the same degree. Further, note that all of wave ((iii)) is above a 0 - ((ii)) trend line. And wave ((ii)) is much less than 38% which typically indicates an extended first wave.

We are now likely in the Minor B wave, and in the (b)-3 wave of a B wave at that. So, wave counting here is ugly. That said, sometime soon the first (c) wave lower should occur.

Also, the leading contracting diagonal for wave minute  should mean that the fifth wave of A, minute ((v)), circle-v, should not be a contracting diagonal by the Principle of Alternation.

If/when the (c) wave lower gets underway it certainly could be an impulse, but it could also be one of two types of diagonals (contracting or expanding), depending on how slow or fast the algorithms want to go. Still some larger down movement should occur to better signal the onset of the Minor B wave.

This is the second post since Friday. Have an excellent rest of the weekend,

TraderJoe

Friday, June 6, 2025

Doji & the Seven-Gaps

Like the title of a bad alt Disney movie, today's SPY contract gapped up starting way before the tepid Payroll Report. We warned we could see some vicious retracement and used the hourly EMA-34 as a marker, but price far exceeded that level and made a new local higher high which is still in an overlapping wedge shape. Price then waffled around lower, making a double-zigzag lower only before heading up near the open to create the Doji bar. Today's gap up created fully the seventh unfilled gap upward, as the daily SPY chart, below, shows.


While the higher prices overall are great for investors, currently, the numerous gaps on the chart, which is not a first, continues to make wave counting a bit more difficult. For the interim, yes, there is an overlapping wedge shape near the high. We pointed out several of those overlaps in yesterday's post. And today added more overlaps to that list. It can still be part of the (b) wave higher as the price difference overall is minimal.

But our most prescient concern is what happens when the algorithms reverse and go "gap hunting" to the downside? At some point that is still likely. Let's just hope they don't go for all seven at once.

Notice 1) price has pulled away from the upper parallel and has made a turn to the right, which is a slowing of momentum, 2) there is still MACD divergence, 3) and also have a gander at green volume here. We have drawn in just one Fib line. Today was the 1.272 from the initial leg of this mess, and the close was almost dead on it.

There are no certainties here, but the wave count feels very much like B wave territory. I don't think the retrace levels are deep enough to consider diagonals.

So, I did get the call to a (c) wave of a larger B wave incorrect for the day. No doubt about that. And, even still, as frequent readers of this blog know a single-candle pattern - such as a doji is insufficent to call a turn. Much better to have a significant closing lower candle. So, Monday could even trade up again, and reverse, or wait until Tuesday to reverse.

What I just really shake my head at as the chart clearly shows how much risk there is up here, and the complacency is amazing to me. Pick-your-gap fill, right?

Have an excellent start to the evening,

TraderJoe

Thursday, June 5, 2025

Bouncing Around in a "B" wave

Our count presupposes that five-waves-up to a Minor A wave, up, has been made and is in the rear-view mirror as shown below on the left in the ES hourly chart. We are now bouncing around in the Minor B wave as given by today's false break-out higher and overlap lower.


So, we suppose that a (c) wave lower is underway, and this may dovetail with the reaction to the Payroll Employment Report tomorrow. Since sharply higher prices are still possible, say to the EMA-34 or so, provided we do not go over today's cash high, it behooves one to use the utmost caution reading these waves.

As we look at the daily chart below. We see that price did close over the 18-day SMA, and so the daily bias is still up. Price did rise to tag the upper daily Bollinger Band and then fell off in an outside-day-down. And both cash and futures technically made their highs on the same 'day' - just not the same hour of the day.


Price then went down near the 18-day SMA and bounced a bit. It is possible that if we make a (c) wave down that it is only "one leg" of a correction - like minute  of a complex -- which could be something like a Flat-x-zigzag to help give the correction some length. Remember, "B" waves can be "any threes". And maybe on the daily chart such a correction would help form a better daily parallel.

This is one of the myriad possibilities for a B wave. A 'multiple Flat' would surely be another. Still, we are looking for a count that provides some downward length - and perhaps overlap - to differentiate it from other counts. So, we'll stay loose and flexible. The next milestone would actually be a close below the 18-day SMA to suggest that the daily bias has changed. The slow stochastic tonight is only around 77, and if stays below 80, it might indicate that price will again try to attack the 18-day SMA.

Only time will tell. For now, there are overlaps galore, and we are following the 'rules' as best we can. 

Have an excellent rest of the evening.

TraderJoe

Monday, June 2, 2025

Three & three ?

On the SPY 15-min timeframe, we do not know that the up wave is over even though it shows signs of tiring. But, so far, the best count is :3, down, and :3, up, to now more than 90% of the prior cash high. As always this is a sign of a potential "b" wave of a Flat, or expanded flat, or the next impulse wave up. See the chart below.

SPY Cash - 15 Min - 3-3- ?


Since tomorrow is Tuesday, one might ask, "if today was an up Monday, will tomorrow see a turn on Tuesday"?. We don't know for sure, but the chart above suggests such a thing is possible. Note the cash high corresponds to the futures limit we posted in yesterday's chart.

Have a good start to the evening,

TraderJoe