Already the wave structure is giving any Elliott analyst difficulty. For example, one opportunity for a true nested wave count, lower, was invalidated. We called it out when the level was exceeded. So, it may be that something else is going on. Looking at the weekly chart of the ES futures we can see several items of note.
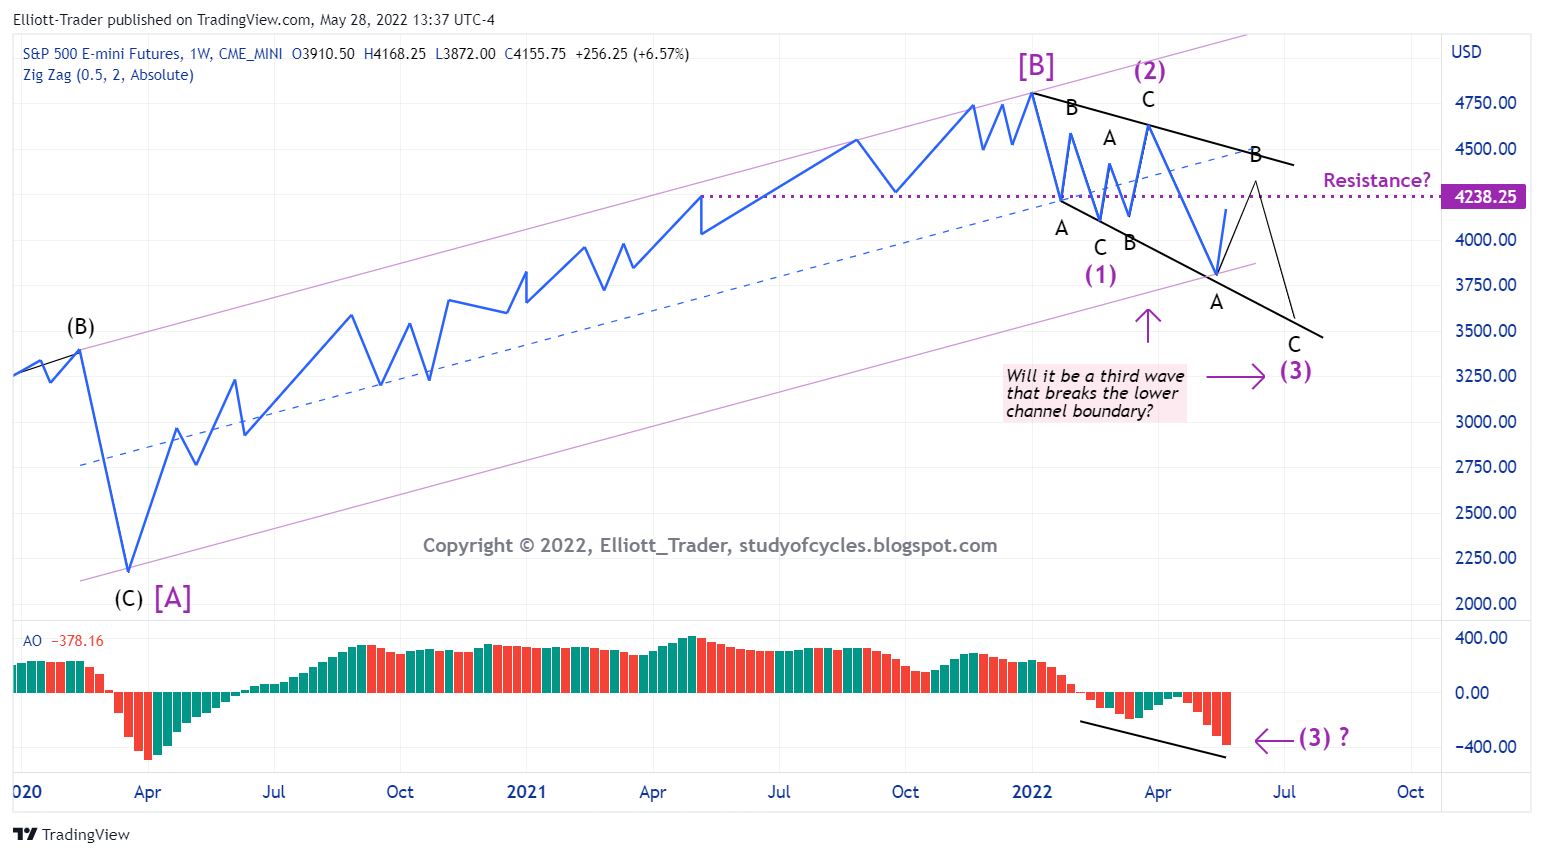
First, we note the current weekly up channel, shown in magenta, and the price bounce off of it. Second, we note prior price peaks & troughs which are connected with the dotted purple horizontal line which is labeled as potential resistance.
Fourth, we note the value of the Elliott Wave Oscillator. It is currently at -378 compared to a prior peak value 0f +412. That is -92% of the prior peak much greater than the optimal range for a fourth wave with 113 price closes on the chart. The optimal range for a fourth wave, as I have noted many times is +10% to - 40%. This is -92% and is much greater. Could it still signify the third wave, lower, but in a different manner than the typical impulse?
Fibonacci fifth, several of us (especially including reader BBRider) have noted the herky-jerky nature of the downward price movements - even as early as the first downward moves - and suggested possible diagonal structure. Is it possible to be forming an expanding diagonal downward? It seems that it might have to be the power of a third wave (3) that breaks the channel trend line - if it does - and that it would be a C wave of a third wave, also powerful, that does that.
We know that overall, the downward wave is longer in price than the first downward wave. But it does not seem to be longer in time yet. Therefore, where all might be trying to count a second wave up, it might only be a minor B wave, up, with a downward "C" wave to follow.
We don't know for sure, but certain indicators - such as RSI - don't look right yet for a third wave. They have not fully gone oversold, and there was little sign of true capitulation at the low. Another item to keep in mind is time. This wave is already longer in time than the drop to the Covid-19 low! And the whole correction is longer in time than any obvious correction in the prior up trend. So, the time relationships should be telling us something as well.
So, this count is something to chew on. It might be a very unexpected count, and might be just what the algo's are trying to use to further whip prices into a jumbled mess.
Have a good start to the weekend and your holiday if you are celebrating Memorial Day.
TraderJoe
Interesting.
ReplyDeleteA zig and a zag, or a zig and a zig? Thought this was interesting as well (to me at least) -
https://www.mediafire.com/view/qo2qkkovjt8pj1o/ZigZag.PNG/file
3 can be complete on your chart. Correct? That's what I posted days ago. Rally to top rail then break bottom rail is another alternative to make low
ReplyDeleteI don't 'think so'. The third wave does not have a good zigzag look on the weekly. Then, too, we could be in a flat wave. And if we are, it can only be a "b" wave of 3. I don't think we'll know until we see if an impulse completes upward, and then fails or not. As I said in the post, the wave counting is a bit of a mess in this structure.
DeleteTJ
Et, you should look at a chart of floor price of bayc nft. I think you may find it interesting. Let me know if you can't find and I'll post.
ReplyDeleteGold/BTC - Is Gold about to make a move on BTC?
ReplyDeletehttps://www.mediafire.com/view/bo0qk6bkm5d8liw/Gold-BTC.PNG/file
They can both go down, gold far less than Bitcoin. BTC dominance chart is pointing to a multi year nuclear winter scenario for all crypto "assets".
DeleteES (wkly) Channels - (fwiw)
ReplyDeletehttps://www.mediafire.com/view/d4ubzexwrvbsy8e/Channels.PNG/file
SPY (15m) (2x3) Updated for Friday's rally - prelim.
ReplyDeletehttps://tvc-invdn-com.investing.com/data/tvc_d32e8a4054e409cd6d69f7c9a6df064a.png
NYSE McClellan Osc -
ReplyDeletehttps://www.mediafire.com/view/zfs0pr9doia2qzo/McClellanOsc.PNG/file
Historical view of DJI:
ReplyDeletehttps://www.tradingview.com/chart/DJI/lJSh7b2r-Historical-View-of-DJI-From-1929-On-Log-Scale/
and a close up view:
https://www.tradingview.com/chart/DJI/wYm3OCut-Historical-View-of-DJI-From-1929-On-Log-Scale-Close-Up-View/
GDX - (0.5x3) Thoughts
ReplyDeletehttps://www.mediafire.com/view/907t20azlmf24i2/GDXthoughts.PNG/file
TJ - in the experimental count, A of (3) seems to be bigger/longer than all of wave (1). Isn't that a degree violation even for an expanding diagonal? If not, then would you agree that this count suggests incrementally larger down waves as we draw out A and C of (5) further out in time to finish the [C]? That would be some real carnage.
ReplyDeleteThat very much depends on where A ended. What if it ended as shown in this ALT count? Then, depending on which trough is chosen for A, it may not be longer than the first three-waves-down from the ATH. Like I said, the wave counting is difficult at the moment.
Deletehttps://www.tradingview.com/x/ikKbE4mP/
This is another reason why I currently prefer the diagonal interpretation.
TJ
can april and may move down be a b wave, just like the move up from covid low is a b wave?
ReplyDeleteNo. That would be a clear degree violation because what you are claiming is the smaller degree b would be larger than what you are claiming is a larger degree 1 in price. TJ.
Delete..although you might want to see this interpretation in response to TJ's question @ 2:11 PM, above.
Deletehttps://www.tradingview.com/x/dksnCAyz/
TJ
I called out that expanding triangle Thursday at 11 am, nothing 2 percent rally not out of question
DeleteFXI (dly) Is China turning?
ReplyDeletehttps://www.mediafire.com/view/pwvdzovr3rq7x5a/ChinaFXI.PNG/file
Supplemental view (0.5x3) -
Deletehttps://www.mediafire.com/view/ckxdew90h8a3x87/fxi0.5x3.PNG/file
MJ (0.25x3) - Looking for a bounce/turn
ReplyDeletehttps://tvc-invdn-com.investing.com/data/tvc_04730770a55e265eb0dd50b7f19266c0.png
Thanks TJ. As you always say long weekends are generally a surprise.
ReplyDeleteWave B is less than twice the price movement of Wave A, including internal points of Wave B...this rule seems breached here in your chart above tj.
ReplyDeleteAs I have written many times, the DOW is a perfect 1.618. The SPX is 2x because of the excess influence of the NQ 100 stocks.
DeleteTJ
everyone is counting 2018-2020 a a flat? check your own post jan 22nd 2020. was a great call. my chart last week has that for the 5th of the extended 1. why ok then, but not now?
ReplyDeleteBecause if the wave in the lines is a 'true' ending diagonal, then the start of the diagonal should have been (must be) exceeded lower in less time than the diagonal took to form.
Deletehttps://www.tradingview.com/x/SaqCwFal/
It wasn't. Therefore, as Neely says, "there was no post-pattern confirmation that the count was correct". That's why Elliott analysts have gone with a flat for the structure.
TJ
ES (wkly) - Still kicking this around -
ReplyDeletehttps://www.mediafire.com/view/66fbnjej9qfb4rv/A_duck.PNG/file
If your 2 was 'longer in time' or even 'similar in time' to 1, and your 4 was 'longer in time' than or 'similar in time' to 3, then I'd say it has a chance to look like the extended first wave in Mastering Elliott Wave (realistic examples). Otherwise, to me, it doesn't look like a duck. I'm not saying it's wrong. It is an alternate to consider. Further, all the extended first waves I have seen usually 'start' a larger wave set upward. They don't end one.
DeleteTJ
I agree that 2 would "normally" be longer in time than 1, didnt know that 4 should be longer than 3 in time. My focus is on price, time is "plus" if you can get it, not a disqualifier (for me). Until recently, we didnt think that the 0-2 TL could be broken on an extended 1st wave, 5 wave move, yet turns out it can.
DeleteSo, perhaps some of the related "generalisms" are just that. Based upon the shallow retraces (so far), wedge shape, RSI declining peak(s?), smaller 4th vs 2nd, Im going with what I see, until the market proves otherwise (which it certainly may do!). Thanks for your response and perspective!
See reply below @ 1:49 PM.
DeleteTJ
S&P stocks above 50ema - (2x3)
ReplyDeletehttps://www.mediafire.com/view/r944bk41jicbhcv/SPabove50-2x3.PNG/file
For those interested in counting waves, regardless of whether you chose the black count or the red count, here are both some price and time considerations using today's five minute ES wave structure (cash not open).
ReplyDeletehttps://www.tradingview.com/x/OZT2mUWj/
There 'are' two equally good alternates with the time parameter indicated as a justification. There were conceivably five waves down. Then, there was either 'a next c wave down' or there was a 'b' wave which was almost 2.618 from it's tiny 'a' wave. But, there 'were' five waves up following it.
Absolutely, the only way to decide is IF the low of b is taken out first or if the high of (b)/(ii) is taken out first,
Yes, there are reasons to 'prefer' the simple red a-b-c down, particularly if a triangle or smaller diagonal is building. But notice how the time parameter is analyzed 'as well' as the price parameter and the wave structure.
That way if the high of (b)/(ii) is 'NOT' first exceeded higher, then we know where we are, as well.
Keep in mind there is no 'absolute max' given for a 'b' in the Elliott Wave Principle, and yes we all know the common 1.382, and 1.618. But, what if the 'absolute max' for a 'b' wave is simply that it not create a degree violation??!!
Question for you all to ponder.
TJ
PDI (0.25x3) - Looks interesting here -
ReplyDeletehttps://www.mediafire.com/view/crwkid8v7cz355n/PDI_0.25x3.PNG/file
RBOB - Is the move up in Gas running out of gas? 🤞
ReplyDeletehttps://tvc-invdn-com.investing.com/data/tvc_99e6e184c967c87a1dcf445a8c365dfd.png
Note/correction - the downward verticals were prelims done before column was complete. Now completed at lower level. The actual verticals are:
Deletegrey - 3.025, and red - 2.525. As the column low has yet to be exceeded, these vertical measures are not yet activated.