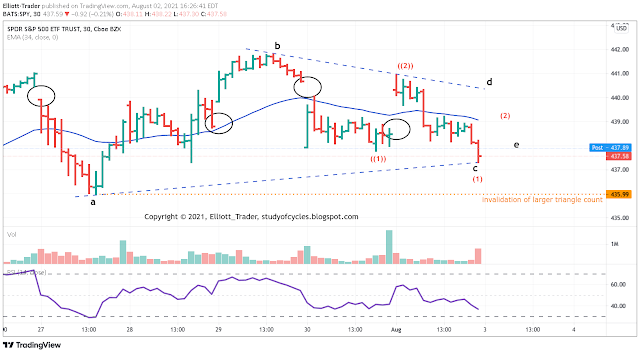
As we showed in comments to yesterday's post, a smaller triangle invalidated in the downwards direction late in the afternoon. However, a lower low in the ES futures lower than the 30 Jul low was not made. Therefore, a larger triangle count is plausible. But so is a downward count for the larger 'c' wave of a (b) wave downward. Both are shown on the chart of the 30-min SPY below.
 |
| SPY Cash - 30 Min - Larger Triangle or Down Count |
While both counts are shown in the above chart, in order to activate the much deeper 'c' wave count lower, then the low of the 'a' wave on the SPY chart above must also be exceeded lower.
Have an excellent start to the evening.
TraderJoe
Triangles vs nested 1,2s can be truly intriguing! Looks to me like one favored by other indicators...
ReplyDeleteAll I can actually see, is: 1) break of 4-hr trend line - will there be a back test and failure? 2) down trending RSI, 'currently', and 3) down trending EWO, 'currently'.
Deletehttps://www.tradingview.com/x/GNfRY57B/
But triangles are known to break trend lines. That's what they do. So, caution is warranted until one scenario prevails over the other.
TJ
Agreed. Exactly what I was watching, in addition to VVIX. We absolutely do need confirmation before confidence is warranted.
DeleteTj i know the focus here is on wave count but at some point you have to guide us how to take advantage of these wave counts for our trading. In the end our goal is to use ew to make money. Thks
ReplyDeleteRegarding the subject of trading, if you have not already done so you should read the information at this link - which I posted years ago. I posted it because I simply can not be repeating it for each individual who may start to the follow the blog at a later time. It is quite extensive and must be studied thoroughly.
Deletehttp://studyofcycles.blogspot.com/2015/11/paraphrase-of-ira-epsteins-rules-for.html
TJ
Thank you great stuff
DeleteSPXcfd (hrly) - early look
ReplyDeletehttps://www.mediafire.com/view/krptyb7gnjo3ak8/Early.PNG/file
Have exceeded the 27th low by a nose (basis cfd above).
DeleteHave retraced new down move by .618 (so far).
DeleteEarly morning high exceeded.
DeleteES 30-min: 4,370 the prior low has been defeated lower. Only ES 4,364.50 remains to defeat a triangle. It certainly 'looks like' a nicely accelerating third wave.
ReplyDeleteTJ
Are you the same Joe of "Trade the Cycles"?
Deleteno.
DeleteTJ
Tremendous amount of capital deployed to vault price back above DJIA 35k and SPX 440. What matters is how we close imho. Most impressive financial legerdemain!
ReplyDeleteSPXcfd (hrly) update and observation -
ReplyDeletehttps://www.mediafire.com/view/gm45zo7y52el4vp/hrlycfd.PNG/file
Was thinking the same but lower degree 2nd could pose a problem methinks...not certain.
DeleteBearish 1-2 count, right to the .618 -- very sneaky, dangerous.
ReplyDeleteYes, as above, there are still downward count possibilities. But, they are only that. (They are 'currently' OK with their degree labeling as in GW's chart). Price is still above the 18-day SMA. But, there could also have been a 'double-bottom (b) wave'. Only way to know is to take out the low or the high.
ReplyDeleteTJ
Have retraced to the .786 area currently.
ReplyDeleteVery close to ((5)) = ((1)).
ReplyDeletehttps://www.tradingview.com/x/fO9LPYTP/
TJ
5th is a Edt as well.
DeleteThe way it shot up is kind of like a spring.
ReplyDelete