Market Indexes: Major U.S. Equity Indexes closed lower
SPX Candle: Lower High, Lower Low, Lower Close - Trend Candle
FED Posture: Quantitative Tightening (QT)
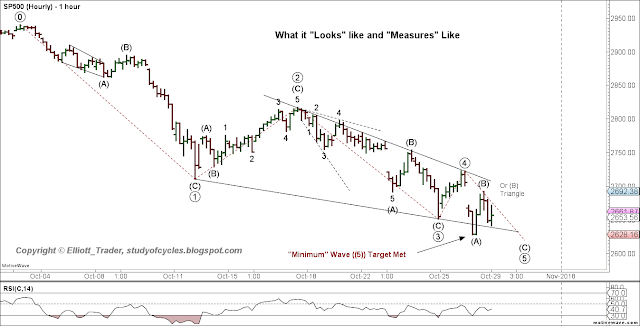
Amazon's earnings forecast hurt futures in the overnight market. It was not until morning that we could definitely say that wave ((4)) on the hourly chart was over. All major U.S. equity markets had daily lower low candles. They are beginning to synchronize. In making the lower low, the "minimum" downside objective for a diagonal count has been made and has been marked on the chart.
Is the diagonal over? Is it the final word in the EW Count? Once again, see the hourly chart below.
 |
| S&P500 Cash Index - Hourly - Potential Contracting Diagonal |
After the morning's drama, there was a sharp rebound to just beyond the 62% level of wave (A). Then, there was a drop to the the 78.6% level on wave (B).
So, it would not at all be surprising if the (B) wave turned out to be a triangle in some form to indicate "last wave" dead ahead. We shall see if things work out this nice & tidy. And, since wave ((4)) has "played fair", and remained shorter than wave ((2)) in both price and time, it would now be up to wave ((5)) to remain shorter than wave ((3)) in price, especially, and time, as well.
If, for any reason, wave ((5)) becomes longer than wave ((3)) then the next best count would be an impulse, but we'll cross that bridge if the market makes us. For now, it's just great to have objective criteria.
Again, more than likely if the five waves of a diagonal complete successfully, and they may have already, then we would likely have minute wave (i) downward, with an expectation for minute (ii), upward. But let's not put the cart before the horse. For now we have labeled today's wave down as the (A) wave, so that the diagonal has better form and proportion. The internal (A), (B) of each downward leg is clearly visible, so, we suspect this one should be too.
Rest up, and have a great evening and a great weekend.
TraderJoe
What did the the A wave say to the C wave?
ReplyDeleteDid you see that middle wave? She was a real B!
Oh yea. B's are tough.
Deletethanks joe
ReplyDeleteWelcome Marc.
Deletewe have a clear 5 wave downside near end maybe What % retracement do you expect? Is possible this 5 wave down wave be a wave 1 of a bear market in beginning?
ReplyDeleteFor retrace, start with daily upper Bollinger band. Go from there.
DeleteThanks Joe for continued EWT education. Curious, you post various timeframes - I assume, based on your 8 step approach, to view a specific wave. Would you recommend charting at the 1 minute level to get faster repetition with patterns / measurements etc? Also, I notice you post using Ninja Trader, Motive Wave, Free Stockcharts etc - different tools. Do you personally utilize all these different tools or is there a group collaborating and each has different tools?
ReplyDelete1. Depends what your objective is. 2. No.
DeleteTJ since you are a diagonal & triangle guy, there is a perfect contracting diagonal that meets all rules and retrace guidelines from 2753ish. It would complete with a new low Mon Am below 2628 but above 2597ish. We're not even close in our intermediate term outlook so I'm not going to say where I think this ED fits in the grand scheme of things. I'm still trying to figure it out myself if it completes properly.
ReplyDeleteET, On 5 mins chart one can see ABC down where A has 3 waves down then up to B and 5 waves down to form ending diagonal down to form wave C. Is that a valid analysis.
ReplyDeleteET, could you please share your live chat room link/information with me too ?
DeleteSend me an email at the profile address, and I'll provide the latest.
DeleteHello Joe. I have been reading your work, and I have to say your work has to be best in business. Could you please share your live chat room link/information with me? I am interested in signing up. Thank you.
ReplyDeleteThanks for saying. I replied by email.
Deletegood morning Joe...I would be very interested in signing up for live chat room link/information..Thank you, John
ReplyDeleteSend me an email at the profile address, and I'll provide the latest.
Deletehi joe
ReplyDeleteno new graphic for the weekend?
Hi dom. None needed.
DeleteET,
ReplyDeleteIf your starting the chat room again I'm interested in finding out the details.
Weekly Rut AO is now below 0. I think if we do have higher highs in the dow and spx Rut might not.
No plans to right now, Bill.
DeleteHi Guru Joe
ReplyDeleteThank you. Just managed to get internet access. Refering to chart labels A-B-C,where C's drop of 190 points vs A's 230 point drop.
Could this correction then be complete if C is that short?
Thank you. Sir.
Joe,
ReplyDeleteDon't know if you're monitoring this right now but have a question.
Looking at the action today it looks as if we are going down to test the lows. I was wondering since the last trip down overshot the bottom of the channel does that increase the odds that this time we might have a truncation and not actually make a new low?
No truncation. New lower low just occurred.
DeleteYup and it looks like we only have 3 of C
Delete