Wednesday, May 31, 2017

Higher then Lower

In a very choppy and narrow point range day today, prices first headed higher in very early morning. Today was 'window dressing' day, the last day of the month. Tomorrow is the first day of the new month - which often sees inflows from 401k's, pension programs, company bonuses, etc.  This effect is somewhat less pronounced in the summer time, however.

The ES futures almost made a new high, the NQ futures did make a new high, and then backed off. The cash S&P did not, contrary to the possible fifth wave up we thought was possible. Within the first hour, when this morning's opening gap was filled, we published the minute ((b)) wave count as likely completed. This is shown below.

SP500 Daily Chart - Minute ((b)) Wave Likely Completed

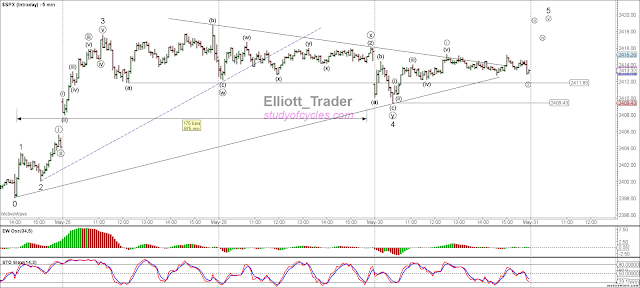
If the upward count is done, it must have completed as an ending diagonal triangle shown on the five  minute chart below. The measurements are correct for such a pattern, and it's beginning has been exceeded lower.

Minute ((b)) Wave Possibly Finished with Ending Diagonal

Near the close of trading today, price has retraced nearly 61.8% of it's downward wave. The exact downward count can be treated as a diagonal with a 61.8% retrace. But I would want to see a new daily low beneath 2400, before a new high of 2419 to better solidify minute ((b)) is over in the upward direction.

Remember, minute ((b)) waves can be real stinky. A new high can't be ruled out - just yet - but it seems less likely. As an alternate, today could just have been the smaller b wave shown currently between (x) and ((b)), on the daily chart.

Have a good evening.
TraderJoe

Tuesday, May 30, 2017

Stall Job

After a slightly lower open, low enough to break the potential triangle we showed you last week, the market then made five "small-degree" waves up, and then went into a stall job for the remainder of the day. The cash market tried to regain the opening gap, but, as of a few minutes before the close, it couldn't do it.

The potential triangle did indeed break down slightly, adding two additional waves that we are showing below, and making the 0.382 x wave 3 mark. The 4th wave now counts as a flat-x-zigzag and that is still an acceptable structure for a fourth wave.

SP500 Flat-X-Zigzag for wave 4, so far

You'll notice how much discussion there was about the potential wave 4 non-limiting triangle last week. It was a lot of hot air over nothing. The triangle did not even exist. Only a potential triangle existed. I show you this short term detail again, so you can see that regardless of how much a structure looks like a triangle or a diagonal, and no matter how much it acts like it, it is not a proven triangle until it meets all the requirements in every aspect.

That did not occur. Some people get mad at this. Some people get mad at the analyst for this. I don't. I'm used to it, and it's what I've tried to explain to you is simply The Fourth Wave Conundrum. The fourth wave structure can be very, very, very unpredictable. Get as angry as you like : this is the real reason people distrust Elliott analysts. Not because the analysts are bad, but certain waves are very, very unpredictable by their very nature. You can call it 'excuse making'. I call it 'experience'.

The current count would suggest that trading down into the gap from 25th May would likely start to indicate a larger problem.

Have a good evening.
TraderJoe

Friday, May 26, 2017

Another Eight Fold Path Example

In yesterday's post, we showed you a fifteen minute chart of the S&P500 Index, and stated we could be in a C wave upward since May24th.  In a special for Memorial Day weekend here in the U.S., here is an SP500 5-minute chart showing this wave in detail as published in the live chat room. The wave, so far, is following The Eight Fold Path, as far as it has gone.

SP500 5-Minute Chart : Wave Follows The Eight Fold Path

So with 175 candles on the chart (versus the recommended 120 - 160), wave ((iii)) of 3 is on the peak of the Elliott Wave Oscillator, and wave 3 is on a divergence, as it should be.  A smaller time frame would result in too many candles, a larger time frame would result in too few candles.

Today's down wave at the start of the session did not break the ((a)) wave low, and yesterday, we had called a ((b)) wave high. Today continued the sideways action breaking the various trend channel possibilities several times. This is what "attacking the lower channel boundary is all about".

Given the very slow nature of the trading day, pre-holiday, and all, and the very light volume, it looks like the overall structure for the waves since the wave 3 high is that of a "running triangle". At the end of the session, we watched as the wave ((e)) low was respected, and the ((d)) wave was broken slightly higher. It could be a set-up for a gap-up Tuesday.

This is both good an bad news. When one looks at how far price has pushed into the apex of the triangle, then the triangle can be described as a non-limiting one. This means that, presuming price breaks the ((b)) wave high properly, price can sometimes run beyond the typical triangle targets before turning lower. This triangle currently projects 8 - 10 points (roughly the width of the triangle), so if you start to see more than that, it is due to the extreme price compression into the apex. That's the good news.

The bad news is that triangles usually precede the last wave in the sequence. So, we may be looking at "the last wave up, dead ahead". The market ending the pre-holiday week on a triangle is fitting. Triangles don't have to complete properly. If they do, great. If not, then they can point to a 1-2 in the opposite direction (which would be lower in this case). If all goes well over the weekend, the triangle should likely break to the upside, as expected. If something untoward or unexpected should happen, then the triangle pattern still allows the market the flexibility to allow that to be expressed, as well.

There are a couple of things not to like about the triangle pattern, the lower triangle trend line is at a rather shallow angle. But, heck, I didn't draw it; the market did. And, the ((c)) wave of the triangle is quite steep - but it did not break to a new low. Still, the Elliott Wave Oscillator is well within it's parameters for a fourth wave, staying between +10% to -40% of the peak in wave 3. So, we should expect to see a fifth wave higher!

Have a good start to the long weekend.
TraderJoe


Thursday, May 25, 2017

DJIA makes 90%

Let's hear a minor hooray! The DJIA finally made that 90% level and avoided breaking an Elliott Wave rule (not a guideline) for the minute ((b)) wave of a flat. The upward wave was a total mess, but we recognized that the lower low in the Dow that was not made in the S&P500 meant we did have another flat construction - which must have also followed the rules for a 90% retrace in the downward direction after the three-wave "a" sequence below from Mar27th to April 5th. It did! It even made a lower low - the very signature of another flat.

DJIA Daily finally makes the 90% Level to Validate a Possible ((b)) Wave of a FLAT

So, the overall upward sequence from March 27th counts as the flat-x-zigzag that we mentioned in prior posts, where a,b,c to (w) is the flat, w-x-y-x-z is the (x), and now we are working on a three wave zigzag upward for the (y) wave. So, while this has been a real terror of a wave to count, we are most satisfied that no Elliott Wave rules are broken.

It is likely that the market knows what you and I suspect - that a strong and steady minute ((c)) wave down is expected for Minor 4, and there had to be a lot of bronco-bucking to make sure no one is on board for it.

The upward movement is probably not over yet, but volume continues to fall off. It will be very interesting to see if the upward-sloping channel drawn in contains the corrective price movement. With today's locally higher high, all of the gaps are now to the down side, and we can envision a scenario where the trading algorithms go "on the hunt" for those gaps at some point in the near term.

You might ask, "how do you know the upward wave is a zigzag"? Earlier today in live chat, I published this 15-minute chart of the S&P500 Index.

SP500 15-Minute Chart

Today's re-acceleration upward was likely the third wave of a (c) wave higher. Why? First, because of insidious price overlaps it is almost impossible to count the waves up until May 23 as anything other than one wave, in itself. Then, yesterday's FED meeting wave was so shallow and overlapping that, on reflection, we can only call it a (b) wave. Price has not really attacked the channel lower, although it did glance off it, and the Elliott Wave Oscillator (EWO) has remained above the zero line almost the entire time.  For these reasons, it does not seem to me that this wave follows The Eight Fold Path Methodology.  There are too many anomalies, and that tells me the upward wave is corrective.

Here is a similar upward wave in 2-Hr Crude Oil futures, and look what's happened to it today!

WTI Crude Oil Futures - 2 Hr Chart - Corrective Wave Upward

Clobbered! ...and now overlapping the minute ((a)) wave up. This is a likely an excellent example of a zigzag wave where ((c)) = 0.618 x ((a)) when added to ((b)) as the green Fibonacci ruler shows. I'm not sure how many of those you get to see in your lifetime, so I wanted to point this one out.

By-the-way, MotiveWave counted the minute ((c)) wave upward as a contracting ending diagonal in beautiful form. I didn't even have to tell it to! If it is truly an ending contracting diagonal, then price should fully retrace below the low of the minute ((b)) wave in less time than it took to build the diagonal. Looks like the chart has a very good start on that objective.

And I hope you have a very good start on your afternoon and evening, too. Cheers!
TraderJoe

Wednesday, May 24, 2017

Kompression

As if yesterday's wedge wasn't bad enough, today's overlapping waves made an even more severe compression on exceptionally light volume. Stocks dropped on the FED's FOMC meeting minutes, then they rose, then they dropped back again, over-lapping over themselves in near psychotic manner.

And while it is possible to count a top today - in diagonal fashion - there is no incontrovertible sign of one yet. Price has not yet retraced below the 2390 level in futures to signify the start of a downward move. The ES futures are ticks from a new all time high, as is cash S&P500. Only the Dow lags. The dilemma of the count can be illustrated most clearly from the Dow daily chart, below.

Daily DJIA Cash

At the point labeled (0), the Dow had not quite made the 90% mark for the minute ((b)) wave of a flat that it should make. Yet, the way down from there measures properly for, and can be considered, an expanding leading diagonal five-wave sequence, either as an "A" wave or a "1" wave. This is shown as the sequence (i) through (v).

But, since the all diagonals consist of three zigzags, then the way down can also be considered just a triple zigzag corrective wave, or "X" wave, instead of "A" or "1". This is shown as the sequence (in circles) w-x-y-x-z.

If the Dow exceeds the (0) mark, it must then be the "X" wave. And, this may allow the Dow to make the 90% mark which it should have for the minute ((b)) wave of a larger flat. This would simply result in a more complex ((b)) wave.

The NQ has exceeded the high today. If the other markets do tomorrow, then it will likely solidify the larger ((b)) wave. And, the upward count may form like a flat-x-zigzag, upward, in the Dow. In such a case, even the prior high in the Dow could be exceeded before starting on the C wave lower.

The only thing we can say is you can see how the volume, while up volume, or green, is falling off badly in the Dow, and this is especially true of the ES futures, too. While that can go on for quite a while, it is not an especially good sign.

Patience and flexibility remain needed to count this market.

Have a great night!
TraderJoe

Tuesday, May 23, 2017

Potential

Potential Only. For the last couple of days, I've been noting this potential wedge shape in the upward direction in the ES E-Mini S&P500 Index Futures. This means there is potential, and potential only, for a turn lower tomorrow.

Hourly Wedge Shape in the ES E-Mini S&P500 Index Futures

If the wedge should break down, it is possible to begin the third wave of the minute ((c)) wave lower of Minor 4. Today, a gap that you can see over on the left hand side of the chart was filled. Note that the downward and upward waves can be counted in several ways. The downward wave did not follow The Eight Fold Path Methodology. Neither did it make a significant new low.

The downward wave can, in fact, be counted as 1, A, or X, and the upward wave can be counted as either a three-wave sequence or a five-wave sequence at this point. So, the overall wave sequence can be 1-2, or A-B (in which a flat is or is not used in either case!). Or, the downward wave can simply be an X wave, such that a higher high is made, and the Dow can try once again to make that 90% level in a more complex minute ((b)) wave.

Additional downward overlaps and/or a cash gap are the item of significance that can help clarify the count at this point. Either way, its a correction, and it's nice & muddy - as correction are wont to be! This is the primary reason that I have no interest in trying to micro-label this count. There are several ways to do it at this time.

Trading below 2,390 would be more significant for the downward count, and a new higher all-time high would be needed for the upward count of a more complex minute ((b)) wave. Patience and flexibility are still needed!

Have a good evening.
TraderJoe

Thursday, May 18, 2017

Daily ES

Below is a chart of the daily ES E-Mini S&P500 Futures. Also shown is a Fibonacci ruler from the Election low.

Daily ES E-Mini S&P500 Futures

If the March high capped minor 3 wave up, and then we had three waves down to minute (a), and three waves up to minute (b), then the most common form for wave minor 4 is five waves down to minute (c).

The most important item on the chart would be the 38.2% Fibonacci level at 2261 as this is a common target for a fourth wave retrace after a third wave is completed. But, in a Primary 5th wave with lousy momentum, there would be nothing wrong with a 50% retrace of this wave, either, at the 2217 level. It would be best not to "micro-manage" this count for several reasons.

First, price can go sideways at any point before going significantly lower - like today. There was an initial lower low, then sideways, making for a green candle overall. Next, there is some evidence already that the downward wave has not followed the Eight Fold Path, and even though it may be counted as a five-wave sequence lower. So, it may only be an "a" wave, lower, and starting an ending diagonal (c) wave, lower.

But, in the less common form of a fourth wave, the exact same sequence since minor 3, can be counted as minute (w), and minute (x), meaning that a minute wave (y) down to minor 4 would only be a three-wave sequence. It is probably the level that is more significant than the form. And the form only reflects the issue we have pointed out before - in numerous posts - and in our YouTube channel. And that issue is titled, The Fourth Wave Conundrum. It is nearly impossible to tell, in advance, what form a fourth wave will take, although some clues are provided in advance.

The most significant clue was that, since minor 2 was a simple zigzag (sharp) wave, then minor 4 could be expected to be a flat, with or without a higher (b) wave, and so far, we are headed very much in that direction. But, it could also devolve into a double-flat or flat-x-zigzag - if that's what it takes to fool the most people - and still make the 38.2% retracement. The only sequence that would not seem to apply here would be a triangle from these levels, because with this form a triangle could not reach the 38% retracement level.

Because this is likely a corrective wave sequence overall, whippy market behavior is still expected. So for that reason, remain patient and flexible.

Have a good evening.
TraderJoe

Wednesday, May 17, 2017

We Tried to Prepare You

On April 28th - over two weeks ago - our post clearly indicated how "Sentiment Soared" and we asked, "who is drinking the Cool-aid now?". Then on May 13th we clearly stated in regard to the triangle count, "The immediate implication of a vth wave up (especially if it results from v = i), would be that a minute ((c)) wave down should occur as a five-wave sequence to end Minor 4."

Then, on Monday of this week we said, "Just keep in mind, the likely (now validated) triangle, and the deep nature of the Dow's wave iv both suggest a loss of momentum, and may be occurring just prior to the last wave-set upward. And keep in mind - since we are likely dealing with a pesky overall ((b)) wave higher - there would be nothing unusual if a truncation occur at or near the top since we are likely in a fifth wave already now." (Underline emphasis added.)

And with those quotes in mind, here is the update of the ES E-Mini SP500 Index 4-Hr chart.

ES E-Mini S&P500 4-Hr Chart Upward Count Completed

And it should be clear, that we are most likely in the minute ((c)) wave down of what will likely be Minor wave 4, on the daily chart.

So what about that Dow? In live chat we clearly indicated the truncation count in the Dow. It did fail to make that 90% level by just a few points, but, in our count, it does have five-waves-up, overall and we did provide a warning to you to expect just such a truncation in a squirrel-ly ((b)) wave count. And certainly, neither the S&P500, the ES, the NQ nor the Russell missed the 90% level - with them making new all-time highs.

DJIA 2-HR - Truncation in the Minute ((b)) Wave Up


We note now how devastating the decline is now that the market algorithms are on a "search and destroy mission" to fill the gaps.

We urged caution, patience and flexibility. We still do. Whippy market behavior is still expected as the $VIX is back up over the 15 level, today.

Take care, and have a good night.
TraderJoe

Monday, May 15, 2017

New All-time High Confirms Triangle Completion

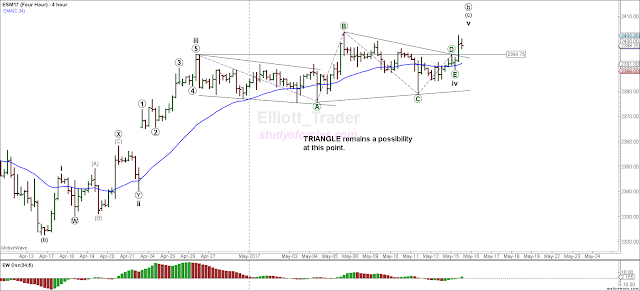
Today's new all time high in the S&P500 verifies that "at least" a triangle upward has occurred properly in the cash index as well as the ES E-Mini S&P500 futures we have been showing you. Here is that triangle count on the futures, again.

ES E-Mini S&P500 Futures Potential Triangle

Today in the live chat room we added the EMA-34 to show how this triangle now has "proper form and balance" because every significant wave in the count is on an opposite side of the EMA-34. Notice that even the new ((E)) wave crossed downward over the EMA-34 to express this counting guideline, and how the ((E)) wave also crossed back down over minuet wave iii to show that it is corrective to it.

The futures have not made the new ATH high yet. They might tonight in the overnight hours. While we are waiting to see if that occurs, here is the same count in the SP500 Hourly Cash Index.

Hourly S&P500 Cash Index with Validated Triangle Shown

Regardless of the specifics, we have a wave that "has moved price sideways, taken up a lot of time, and occurred on low or declining volume". Besides the 3:3:3:3:3 structure of the zigzags in the triangle the previous verbiage describes the essential nature or personality of a triangle.

We note that while the DOW is making good progress in it's attempt to make the 90% level representing the possible minute ((b)) wave of a flat, it simply isn't there yet.  Here is the updated chart as of today.

DJIA - 2 HR - Good Progress on the 90% Level

Because the Dow has not made the 90% level yet, we may see more upward waves in this move. And if we do, that is fine.

Just keep in mind, the likely (now validated) triangle, and the deep nature of the Dow's wave iv both suggest a loss of momentum, and may be occurring just prior to the last wave-set upward. And keep in mind - since we are likely dealing with a pesky overall ((b)) wave higher - there would be nothing unusual if a truncation occur at or near the top since we are likely in a fifth wave already now.

Give it all some thought, and thanks for hanging in through some of the technical difficulties.

Have a good night!
TraderJoe

Saturday, May 13, 2017

Update on Potential Triangle

Here is an update on the potential triangle in the ES E-Mini S&P500 4-HR chart. If this triangle completes properly, it may allow for a new high. And if a new high occurs in the S&P500 Index, then it might similarly allow for a new higher local high in the Dow Jones Industrial Average.

ES E-Mini S&P500 Futures Potential Triangle

Essentially, all of the requirements of a triangle in this index have been fulfilled. All of the waves internally overlap and wave ((E)) overlaps wave iii, downward, demonstrating that the potential triangle is corrective to it.

Wave iv would now be much, much longer in time than wave ii, and the triangle may represent the wave before the last wave up in both indexes. If the indexes do struggle to a new high, it would be one of the longest and most protracted upward  minute ((b)) waves on record.

The immediate implication of a vth wave up (especially if it results from v = i), would be that a minute ((c)) wave down should occur as a five-wave sequence to end Minor 4.

Still, however, this triangle is only a potential triangle. To be a proper triangle, it must demonstrate that price can exceed the high of iii before traveling below wave ((C)), downward, the invalidation point.

Potential triangles, being what they are can sometimes expand once. This means that, in the process of traveling sideways and taking up time, it is possible for the ((D)) wave to pop once higher, and to get an ((E)) wave a little further along to the right-hand-side. This would / will be OK if the ((E)) wave comes back down to overlap wave iii, again. If prices travel north without the return overlap for the ((E)) wave, then one simply assumes the triangle is over as of today. Usually triangles like this can be more symmetric, however, which is why we must allow for a higher ((D)) wave - since the bottom of the potential triangle is relatively flat.

The Dow Jones, on the other hand, can be seen to be in a regular FLAT for it's wave iv, with a clear lower low that the ES futures so far have just refused to make (twice!). A chart of the Dow as of the close on Friday is below.

DJIA - 2 HR - Wave iv is a FLAT

It is interesting, that within wave iv, but not overall, the ((B)) has made the 90% level of the ((A)) wave. We also counted the five-wave down expanding diagonal in the live in the chat room.

The reason for showing this chart is that it is possible that the DOW and the ES will synch up while the ES is in the triangle process. That is certainly a possibility providing that the triangle completes in proper order.

In case you are one of the individuals that is skeptical of wave counting, and / or Elliott wave work, here is a chart of the Russell 2000 ($IUX, on my quote service). Look at the beautiful, ending contracting diagonal that was formed for a C wave, upward, just before the Russell spilled to a fresh lower low.

Ending Contracting Diagonal C wave in the 5-Minute Russell 2000

In this clear example, wave v is shorter than wave iii, wave iii is shorter than wave i, wave iv is shorter than wave ii, wave iv overlaps wave i, but does not travel lower than the end of wave ii, and each wave sequence within the diagonal is a clear three-wave zigzag. Perhaps more importantly, wave i has it's crest clearly above the former high, signalling it's true motive character. This is way most contracting ending diagonals form. This is the pattern that should be looked for above all else before considering a true contracting ending diagonal.

It is clear from the above chart that price then rapidly and quickly retraced the entire diagonal (beyond the point marked as 0), in less time than it took to build the diagonal. This is a critical measurement and this diagonal passes that test, and how!

I hope you will keep this example in mind, because you will see beginning Elliott analysts that haven't quite grasped the concept yet, trying to call all sorts of waves that don't have their start over the prior high as contracting diagonals (when often they are just "b" waves of one degree or another).

That said, it is not at all clear that this observation applies to expanding ending diagonals. Just look at the DOW chart, above, and the expanding ending diagonal ((C)) wave of iv. It seems to me that because of the very compressed nature of the expanding diagonal, it almost assures that while wave (i) in an expanding diagonal will be recognizable for one of several reasons - such as traveling outside of a parallel channel, or making a larger recent retrace than previous ones. But, whether it exceeds all of the prior lows (in this case) of the prior wave certainly seems nearly impossible. Yet, wave (v) in this sequence has, and now price is currently above a declining diagonal trend line.

It is good to have the Google Blogger editor and upload service back on line - at least temporarily. Let's see if it stays that way, and have a great weekend.

Thanks for your support through the technical glitches.
TraderJoe

P.S. In order to see if file space limitations were involved in the technical problems, a number of blog posts with interim status were removed (and unfortunately can't come back). When deleting a lot of old posts and files did not resolve the issue, it told me almost completely that the issue was with the host. I tried not to delete the most important posts - such as The Eight Fold Path, and the Paraphrase of Ira Epstein's Guidelines for Trading.




Friday, May 12, 2017

SE - NC

No, not Southeastern North Carolina, SE = Some Evidence, NC = Not Conclusive. There is some evidence now of a possible very ugly triangle in the ES E-Mini S&P500 futures, as pictured below. Please click on the link (which is only to a picture on my main web-site).

Potential Triangle Count

If a triangle does form properly (and one may have already), then it would likely precede the "last wave up" in the ES and S&P500 - perhaps allowing the DJIA to make the elusive 90% level for the minute ((b)) wave of the flat. It is possible to count the up wave as .d and this morning's down wave as the .e wave, but the triangle is not yet conclusive as of this time.

It would be 'nicer' from the perspective of form & balance if a larger .d wave was made, followed by another .e wave down. But, this does not have to occur.

From the standpoint of invalidation, such a triangle would invalidate below the low of the .c wave.

Sorry I could not post the picture directly. There is some issue with Google Blogger that I am trying to resolve. It has resulted in less than timely posts.

If the problem continues, I will be forced to move all activities to my main web-site.

Thanks and hang in there,
TraderJoe