The front month futures currently show the clearest, countable pattern in the four-hour time frame. As we said earlier the initial pattern is a 3-3-5 Flat pattern, as below.
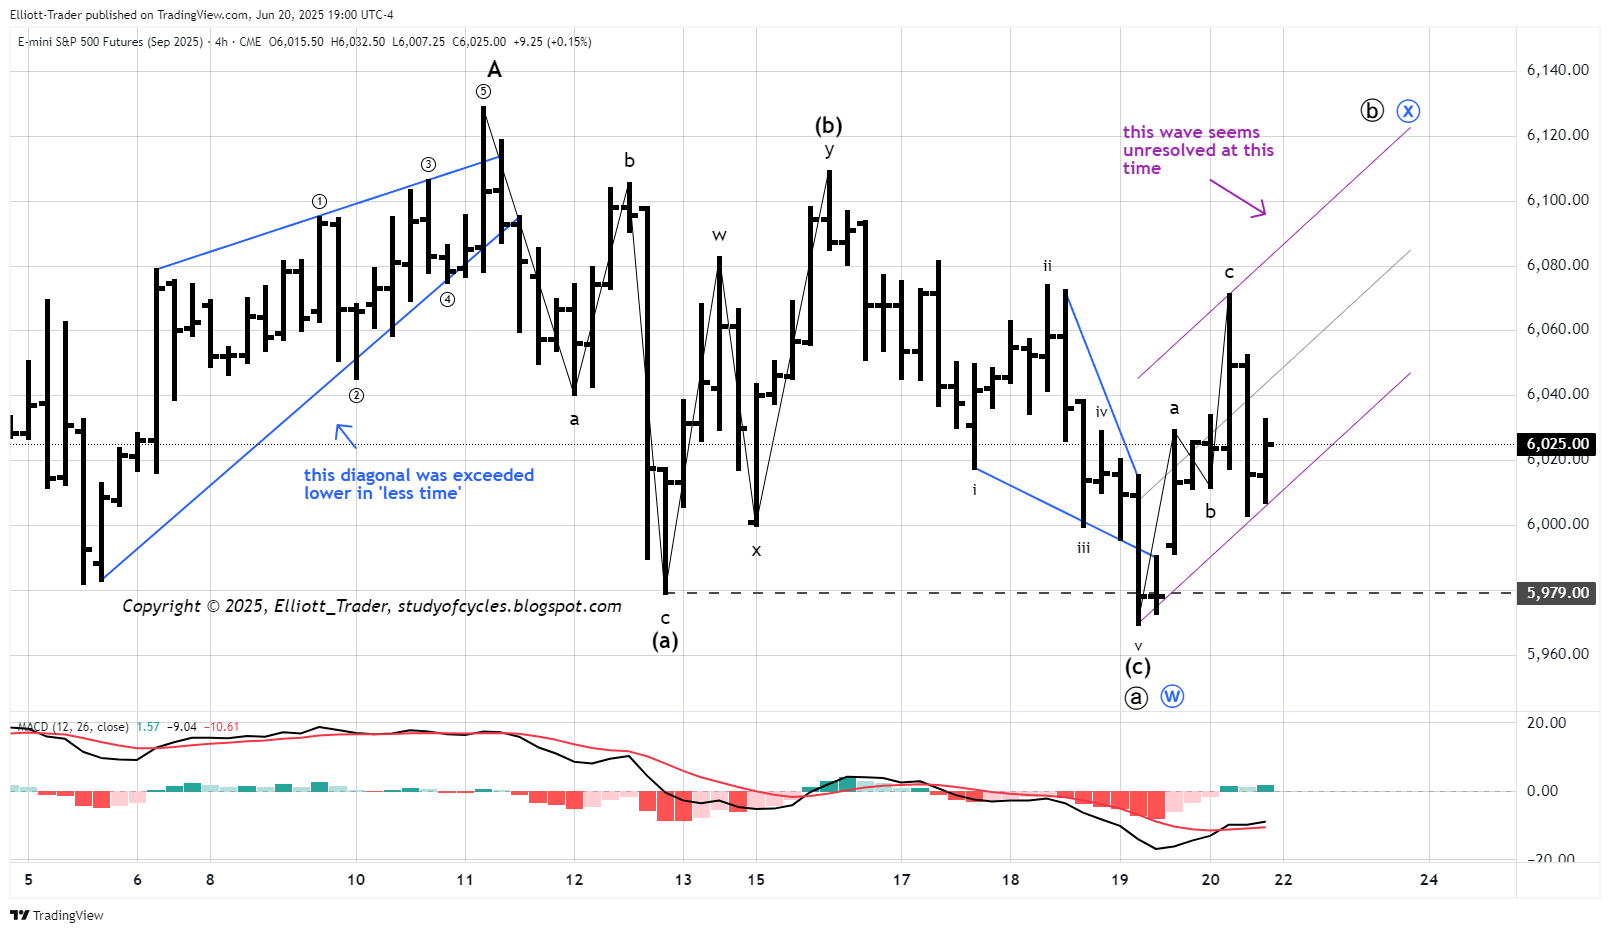 |
| ES Sep Futures - 4 Hr - Flat Pattern |
This makes the low on the 19th either a minute-ⓐ or a minute-ⓦ wave. These down waves - and their hesitation and halting nature - likely represent the "battle for the 18-day average" back on the daily chart.
The current up wave seems unresolved currently because a slightly larger parallel can still be intact. The question is how high a minute-ⓑ or minute-ⓧ wave would go. For example, Friday's c wave stopped almost precisely at the level of the prior ii wave, up, of (c), down. There is a non-zero probability that the up wave is over, and, if so, because it did not reach the 90% level it would be the minute-ⓧ wave, as in the pattern known as a Flat-x-zigzag. The zigzag extends the wave lower. Otherwise, if the 90% or better level is reached, the multiple-flat (double-three or triple-three) pattern might be in play.
For those considering the structures shown, we note that the (c) wave is longer-in-time than the (a) wave down. This again means that the two waves should be of the same degree or else the (c) wave down would be of one-higher degree. For the moment, we see them as the same degree as their price extents are very, very similar.
Have an excellent rest of the weekend,
TraderJoe
Hey TJ when you have time pls share your knowledge about the structure that I see all the time which seem like 5 waves although 2 and 4 are not that distinct but this structure turns out to be a correction instead of 5 wave impulsive. The fact that 2 and 4 are not that distinct may suggest this is some form of abc....
ReplyDeleteJack, I need a link to a chart of what you are seeing. You haven't specified an instrument or a timeframe. I wish I could read minds, but I can't. TJ
DeleteTJ, what about the ndx upper line, it's still resistance? It's still wave B and wait for wave C to the downside?
ReplyDeleteLady S as much as I like to help, you must learn the Elliott Wave patterns by reading. You must practice and show your best work here if you want responses. It is not up to me to count for you - for your favorite index. I do not have time to count everyone's favorite. You must also learn what 'invalidation' is and how to use it.
DeleteBelow is only 'one' of the possible B wave patterns. I mentioned in the prior posts there were 13. They have to be eliminated step-by-step.
https://www.tradingview.com/x/Q62wVTb4/
They are B waves. They are flaky. There is nothing I can do about that. It is you that must learn how they can form, and how to rule-them-in, or 'rule-them-out'. I can not do that for you.
TJ
Thanks a lot, I just asked you about the long term channel you put her if you remember and you sign 5 waves then A and B and you label the C wave that for the future
ReplyDeletethat can still happen, but you 'keep' asking. Lol. TJ.
DeleteThanks
ReplyDeleteon SPY it looks like 1-2 of a leading diagonal is complete here at the close. Oil also looks like an ABC complete today.
ReplyDeleteA new post is started for the next day.
ReplyDeleteTJ