Thursday, February 29, 2024

Brutally Whippy

Yesterday, we suggested there could be a new low this morning. There was in the futures at around 3 AM, as this first ES 30-min chart will show.


However, due to the markets take on the PCE report, that low did not appear in cash. So, we got part of it right, part of it wrong. Does the market give 'partial credit'? The cash market gapped up at the open, and then retraced fully 78%, or more, depending on where one measures the low from. There is not too much to be sure of, but after showing this next chart of the cash SPY 15-min time frame, we can discuss what does and what does not appear.


First, as stated, the new overnight low did not appear on this chart. Second, yesterday, we had counted three-waves-down on the closing only 15-min chart, so we have left that in place as the equivalent Ⓐ,Ⓑ,Ⓒ down. Then, after that, the one item we are sure of - by measuring - is that the 90% up level was reached in cash before a substantial overlapping retrace wave occurred. (This 90% level was not exactly reached in futures).

So, there are currently two zigzags upward, and they appear to be in a channel. But here is what we do not know.

  1. We don't know upward movement has ended for this wave. A third zigzag upward could be made.
  2. We don't know what effect, if any, the 'first-of-the-month' inflows will have on the market tomorrow.
We also know it is whippy. Brutally whippy. We have urged the utmost caution, patience and flexibility. Maybe we are making a larger more complex flat wave, and this is all or part of a "B" wave up. But B waves can still do some mind-bending, head-scratching things, so by-all-means, be careful in this environment.

Have an excellent rest of the evening,
TraderJoe

Wednesday, February 28, 2024

There Should at Least be a -5

Let's say that you are even a raging bull (which I'm not, I'm neutral) expecting a lot more upside. Then there are two ways that there still should be five-waves-down to start. The two most typical cases are below. The first suggests that maybe we are in a triangle consolidation on the ES daily chart.

ES Futures - Daily - Two of Three Ending Scenarios

IF we did not already have the running fourth wave that was previously proposed, and the fifth wave up of minute ⓒ, the triangle shown is a very typical way to nearly conclude a move. The reason for a running triangle would be to consolidate the almost 20 days of up movement in wave iii. This can take some time. However, triangles should consist of relatively clear zigzags that wind around wave iii. So far, the down movement doesn't come close. But the next zigzag should start with a five-wave (A) wave as shown in the left-hand panel.

IF neither of the above two scenarios play out - and let's be clear - the first one of the two scenarios is that completion has already occurred, then the next most likely scenario is the diagonal ending as seen in the right-hand pane.

Yet, this structure, too, must be composed of zigzags - which would also start with a five-wave (A) wave down in order to begin a wave  within the diagonal, saying that wave  is already completed. To that end, we showed this chart late in the comments section for the prior post, and it seems to suggest with a lower low there will be five-waves-down.

SPY Cash - 15 min Close Only - Current Count

Note that in the post-market price is already below the Ⓓ wave. Still, a wave five, v, on the above chart would need to be seen and to have some length to it. (Note that the wave degrees in the above chart for now are relative only and are just for illustrating the comparison).

In the hourly futures we suggested counting on, it is possible an expanding diagonal will be made, but we will look for other options, as well.

Have a good rest of the evening and keep an eye out tomorrow.

TraderJoe


Monday, February 26, 2024

Bait & Switch ?

Advertise A-I, deliver bombs? The recent A-I craze may have all but blinded retail traders into thinking this is a 'one stock' market made up of NVDA and no other. Clearly, we know that's not entirely true because AMZN is also near its all-time high. Yet a lot of articles read like that, and a lot of web-videos play like that. But are we missing anything? Of course. Also, beneath the surface, don't forget the fact that - sadly - the 'usual' way countries avoid or get out of recessions is to use the 'war play'. The chart below is of General Dynamics, one of the U.S. leading defense contractors, on a weekly basis.


While not as dopey gapping as NVDA is, the chart is also at its all-time-high as the country continues to sell arms in Ukraine, for sure, and likely in Israel as well (and many other places). Bombs don't have to be the only product. There can be "systems", drones, parts, consultants, etc., etc. And clearly, the U.S. and other countries are using arms to directly to defend ships in the Red Sea.

So, as the market is selling you NVDA, and AMZN and this is occurring even with divergences with HYG and the Dow Transports not having made a new higher high, just remember this key form of market 'stimulus' is insidiously occurring as well. I rarely look at the defense sector because I just assume with half-trillion dollar defense budgets this form of market pump is almost always occurring. Do you wonder why the solutions to these seeming intractable battles take so long? What incentive is there to solve the issues? Aren't there also some perverse incentives here 'not' to quickly solve such issues?

My apologies for being cynical. It really isn't me. It's the fact that war is often seen as a 'good thing' by markets rather than being seen as a bad thing for populations.

Have an excellent start to the week, and don't forget about those who are in dire circumstances because of this nonsense.

TraderJoe

Friday, February 23, 2024

Two Best Daily Counts

The side-by-side ES daily closing-only charts, below, show the two best ways to label the up move since October. The Principle of Equivalence says that we can consider both counts the same until they are not.


On the left is the minute a,b,c count from an X wave, and on the right is the minute i-to-v count from a B wave. In the minute i-to-v count, the first wave ((i)), circle-i, is the extended wave in the sequence. 

To me, it may be that the only thing that separates them is whether in the second count, the second wave, ((ii)), circle-ii, might just measure to be too small to actually even be a second wave. 

Yesterday, we said our ES 8-hr wave could be topping in a fifth wave (v). After an apparent exhaustion gap upward, prices did reverse a bit and closed just about unchanged to lower - depending on the market. This occurred as prices struck the upper daily Bollinger Band in only an over-bought condition, and not in an embedded condition. So, we'll try to take some additional clues from Monday.

Have an excellent rest of the weekend.

TraderJoe

Thursday, February 22, 2024

Best Explanation

By far this seems to be the best explanation of the wave structure on the ES 8-hr chart, with the wave structures as we called them predominately in real time or as soon as we could after the market opened in the morning.


The chart was done in Motivewave for confidence on wave lengths and wave structures. Wave (iii) is just inside 2.618 x wave (i), and, currently wave (v) = (i).

The Elliott Wave Oscillator (EWO) has crossed to below the zero line and back above and is well within parameters, and the significant numbered waves cross back-and-forth around the EMA-34 for good form and balance.

The pattern is full of diagonals, triangles, and extensions making wave counting tricky. Yet, this is what was experienced in real time. Can the up wave go further? It can. If the (v) (i) Fibonacci relationship breaks, the next best would be (v) = 0.618 x net [(i) through (iii)].

Have an excellent start to the evening,

TraderJoe

Tuesday, February 20, 2024

Still Inside of Range

It is just 'interesting' at this point that we have not yet exceeded the high shown in the count that was presented in the blog post of February 13th, and, again, below.

ES Futures - 90 Min - Top Possible (From Feb 13)


We are still inside of the range of the down wave from the high. Neither has a lower low been made. There is, of course, a possibility of a new high but that depends on the down wave having been a :3 and not a :5 (possible) and making, say, a triangle for a larger fourth wave. That alternate view would be invalidated if the low of the 13th is exceeded lower. Now is the time to watch and measure carefully, being calm, patient and flexible.

Have a good start to the day,

TraderJoe

Friday, February 16, 2024

One Target Reached

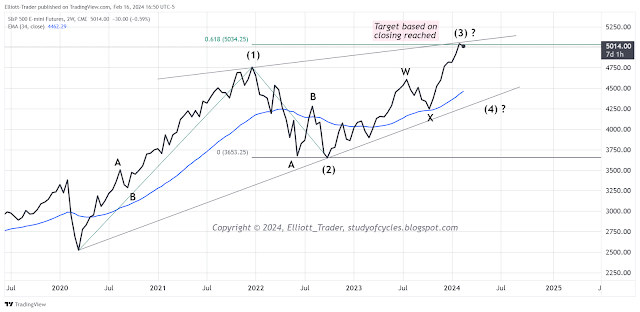
According to the contracting diagonal interpretation of the current up wave, one target was reached in the last week. That target is based on closing prices on the 2-weekly closing-only chart below.


The target reached was (3) = 0.618 x (1) based on closing prices. This target was anticipated as it is a common measurement in larger diagonals. 

We are categorically not saying that the up wave is over. There are ways we can see upside squiggles yet. All that is being said is that a target has been reached, and if the up wave gets beyond (3) = 0.786 x (1), then the pattern would tend to lose the "right look".

Another item we are noting is that risk is getting higher with each passing day. For example, if you are one of the people that thinks every Friday must be higher because of the day-of-the-week, well, "first it wasn't, then it was, then it wasn't again".

From an Elliott Wave perspective, we can still see how some fourth and fifth waves higher on smaller degrees could proceed higher. We're not interested in them. They will be fraught with large twists and turns during which a wrong move could be costly - more costly than likely upside reward at this point.

Rather, we are looking for confirmation that a down trending wave on the swing-line indicator with closes under the 18-day SMA has begun. This might include the breaking of a daily trend line by a significant amount, then a back-test, and then a failure of that back-test. Until we see such, there is primarily conjecture. 

Have an excellent start to the evening and the weekend.

TraderJoe

Wednesday, February 14, 2024

Inside Day

Today was an inside day on the ES daily futures. We were counting as such, and our pattern expectations were not unmet. But it does make tomorrow a fairly critical day. Here is the daily chart of the ES futures.


As you can see price is still over the 18-day SMA, imparting a positive bias to the chart. Yet, the swing-line study (developed by Ira Epstein, broker with the Linn Group) has a recent lower low but a higher high.

In order to turn this study downward, it is necessary to make a lower low than yesterday and close below the 18-day SMA before going over the high first. Right now, that hasn't happened yet, and until/unless it does there is not a firm trend in force. But, if it does happen, it would likely be very significant to subsequent price action.

The daily slow stochastic has lost its embedded status, so let's see how it goes. In the meanwhile, one just has to be agnostic, flexible, calm and patient about the situation. A lot of things could happen including closing of the down gap, first, or the formation of a triangle.

Have a great start to your evening,
TraderJoe

Tuesday, February 13, 2024

One Down

Thanks to this morning's CPI report, one gap in the downward direction was filled. Not the first one down, the second one down. It is shown as the black circle on the daily chart of the cash SPY index, below. There is another small gap nearer the high on the up sequence.


The market gapped down in humorous fashion, leaving another large gap on the chart. Volume picked up a bit, the Dow broke its diagonal (noted yesterday) lower, the tentative parallel above was broken lower, and two of us were able to count 'five-down' with lower lows for the ES, YM and NQ futures by the end of the day. I say 'humorous' fashion because it is really silly that the game is structured such that everyone has to wait until a certain minute and then hit a buy or a sell button at that time, fighting with the news-reading algorithms that can outgun any human. And then, of course, the cash market is closed at that time, and it's another lurch to wait until the open and see what more volume does to the market. Why these news reports don't come out with the cash market open is beyond me. It really seems like another way for the big players to get an unfair advantage against the retail trader. I don't have a co-located server, do you?

From a wave counting perspective, with five-down we now need to see whether the high holds, and if it does whether 482.50 is exceeded lower. If so, we may be well on the way to Minor A down of Intermediate wave (4).

Have an excellent start to the evening,

P.S. I put this chart together last night after the close, as the composite of the triangle I suggested and the expanding diagonal that BBRider called was completed as well.


I do find the count compelling as all the right waves are in the right place and there is "post pattern confirmation" of the diagonal and the triangle having been exceeded lower, the diagonal in "less time".

TJ

Monday, February 12, 2024

Meh

Today's SPY candle on the daily chart, below, is a Doji. The sell-off occurred as some brokers notified some clients of increased margin requirements before tomorrow's CPI report, and as some people just decided to exit before the big reports.

SPY Cash - Daily - Doji

This candle style is one of indecision, and it occurred on continued reduced volume. The major problem with a candle like this is that - even though it shows some of the Smart Money didn't like the highs, and they made a tail there - it just doesn't show sufficient power to the downside. Price did not fill any candle gaps lower, nor did it break the temporary (dotted) channel, shown, lower. So, there are still ways that Flats, Triangles or Diagonals could resolve upwards, even though there was some overlap on an impulse we were trying to count intraday.

For example, we showed in the comments for the prior post, on the Dow (YM) futures 4-hr chart, that some or all of a diagonal could be in the making.

Price movement after the reports may provide some clues but the above lack of power and speed is the primary reason significant follow-on candles are needed to provide better confirmation a trend change is underway.

For this reason, patience and flexibility remain the requirements of the day.

Have an excellent start to the evening,

TraderJoe

Saturday, February 10, 2024

S&P 5000

Friday, the S&P500 closed above 5,000 for the first time. Shall we call it the S&P5000, now? Clearly, just joshing. Now, using OHLC prices, we look for the following Fibonacci confluence on the 2-weekly chart of the ES futures. That confluence is in the narrow band between 5,116 and 5,130. Price closed at 5,044 on Friday.


The confluence results from the 0.618 extension on wave (1), and the 1.236 external retrace on wave (2). Will such a confluence hold? Well, the daily Bollinger Bands are still above the market and will likely be there on Monday, too. Further if you examine the chart at this LINK, the seasonal tendency for the month of February tends to be that the market is soft beginning around Feb 12 - 13.

Despite the "feel" of a third wave - which is why it is labeled as a "three" - the divergence on the Elliott Wave Oscillator on this time frame is still holding. If it seems like forever for those who monitor the markets daily one must remember that these are two-weekly candles!

The best alternate for this count would be: (1) = V, (2) = (A) and (3) = (B). But there is no need to invoke the alternate just now. Price is not to targets yet. If there is a fourth wave, (4), then there should almost certainly be overlap with wave (1). And sometimes, the fourth wave breaks the 0 - (2) trend line in order to create enough bearishness for wave (5).

Again, this two-weekly diagonal count is favored because there has not yet been a proven significant ending sequence (like a triangle or diagonal) on the weekly time frame unless one counts 2018 - 2022 as an expanding triangle. This is possible, but it also may just be an expanded flat, then giving rise to the diagonal above. Whereas, if that period 'was' a triangle, it should have been quickly retraced after the thrust out of the triangle. That did not happen.

As before, caution, patience and flexibility remain the requirements of the week. If a mass of traders goes with the seasonality ("past history is no guarantee of future returns...") then it could look like the turn is coming out of nowhere - even though we have shown how mature the daily count is. Three points must be emphasized on the daily chart below.


First, there is not even a trend line break of the most recent three-touch trend line. Neither is there an attempt to back-test the line nor a failure of that back-test. Second, there is not so much as a true signal candle let alone a follow-through candle to the downside. A true signal candle could be an evening star or a bearish engulfing or a spinning top. None of those are seen. Rather, what we have is a 'stub' candle. Now, to be fair other red bars after stub candles are shown at the blue down arrows. So, a top could happen in this manner, it is just less likely. And third, there is not yet a lower low on the daily RSI indicator.

So, it is all true that sentiment is overblown. The daily put-call ratio is down to 0.48 as of Friday - a recent low. The percent bullishness is quite high. The CNN Fear & Greed Index is back in "Extreme Greed". The NYSE advance-decline line is not at new all-time-highs while major indexes are. The widely followed McClellan Oscillator has been diverging for weeks. And High-Yield-Bonds (HYG) have an unprecedented weekly divergence. Yes, all of that is true. So, we are on alert. But that is different than doing anything in a disciplined manner.

Have an excellent rest of the weekend.

TraderJoe

Thursday, February 8, 2024

S&P 5000 - Minus (Con't)

The S&P crossed the 5,000.00 mark today but couldn't close above it. We showed the following two-weekly chart for the Dow earlier. We note the ES futures are nearing the 0.618 extension of wave (1). That price is 5,034.25 and is only about 15 - 20 points away depending on how exact you want to be given closing-only prices.


Still, although the wave count is getting very, very mature there isn't a sign of a turn yet, and one needs to just be aware that downside risks are piling up. Sentiment, narrowing breadth, and unfilled gaps are just a few that we've covered. Further, intraday price action is getting exceptionally overlapping making triangles, or parts of flats, and/or diagonals.

Caution flags are up. Patience & flexibility are the requirements of the moment. 

Have an excellent start to the evening.

TraderJoe

Wednesday, February 7, 2024

S&P 5000 - Minus

Yep, you read it right. Should we now call the S&P500 the S&P5,000 ? It's amazing that the Smart Money that has accounts large enough to move markets couldn't find 0.11 of an S&P point today. The S&P intraday high was 4,999.89, which is 0.11 shy of the mystical round number. Still, regardless of what they did (and they might hit it or pass through it tomorrow), the market's Elliott Wave count is getting very mature on the 4-Hr cash chart below.


There are five clear, non-overlapping waves up in a channel with the waves 2 & 4 (degrees shown are just relative, for now) showing alternation. Wave 2 is a Flat, and wave 4 is a zigzag. The market is also 'torn up'.

We are showing with dashed red lines the locations of fully seven unfilled close-to-open gaps on the chart. Some - or all - of these could fill on the way down. But first we must wait for a decent turn. There are a few upward squiggles that could still play out. Fifth waves can extend. But we'll watch, wait and be patient. 

Meanwhile, over in the Crude Oil market (WTI CL futures) we showed this daily chart a couple of times now which suggests Crude is in the process of making five-waves-down if it completes properly.


So, we're on the watch out for a lower low or a failure before perhaps a turn higher. Either way it should be interesting.

Have an excellent start to the evening,

TraderJoe


Tuesday, February 6, 2024

Tic-Toc

No, not the movie clip kind; the clock-sound kind. The NQ & EQ futures have the possibility of making a further higher high. So far, they have refused to do so and have only moved sideways. Both futures charts can be counted with triangles on their two-hour time frames.

NQ Futures - 2 Hr - Triangle

There is a smaller version of the triangle that can be considered complete at iv. There is a larger version which could complete later in time. If either triangle plays out, it often signifies that the last up wave in the series is dead-ahead. If the NQ makes a barrier triangle, as above, then sometimes, the move out of the triangle is somewhat shorter than the usual technical triangle target of the largest width of the triangle added to the breakout point.

In the NQ, the triangle suggests that 18,000+ is do-able but not required. For now, though, we wait tic-toc inside the potential larger triangle. And, as the candle tails show, one wrong move and the triangle tends to move against the trader. And that why the expression arose, "trading in triangles can be treacherous".

Have a good start to the evening,

TraderJoe

Saturday, February 3, 2024

Cycle Degree Over-Throw

Back in 2022 we published the chart at this LINK that indicated one of the two likely monthly scenarios was that we were in a Cycle V overthrow of a long-term channel. Please remember that - with these even higher prices - we are now even further into that over-throw. In this Friday's price action, higher all-time highs were made even as twice as many stocks declined as advanced! With that in mind, we focus in on the two-weekly closing price chart. This chart has about 109 candles on it, and it may come in around 120 - 160 when the chart is completed.


This recent up wave has been dynamic, even though it started out with overlapping sequences. Given the new all-time high price action, it registers like a 'third' wave and that is the way it is labeled above as Intermediate (3). Again, the advance-decline line is really diverging here. So, it may mean that a fourth wave will begin sometime in the next week. If a fourth wave begins, then the EWO would also put in a divergent high, as well.

If that occurs then wave (4) 'must' be a zigzag, although the B wave in the zigzag could be a flat or a triangle. But, overall, the sequence must count like a zigzag. So, now let's focus in on the Minor Y wave since the October 2023 low of the Minor X wave using the ES 8-hr close-only chart.


If we use the following factors in the analysis 1) degree labeling, 2) shallow depth of retraces for extended first waves, and 3) RSI divergence along with advance-decline divergence, we see we might count the Y wave as a zigzag. Note that wave minute is the deepest retrace on the chart, and so - by degree labeling - it should be the largest downward degree label. On this chart it is.

As we said on Friday, the NQ futures have not yet gotten over the all-time-high. It would be great if they did to put the major indexes in gear. So, wave minuette (v), up, may still be unfinished. But cracks are starting to appear, so be alert.

Have an excellent rest of the weekend.

TraderJoe

Friday, February 2, 2024

Hit the Upper Band

ES daily prices went up to the upper daily Bollinger band - and then some - before backing off to below the band a bit later in the session.


In the process, the daily slow stochastic lost its embedded reading. This may only be a 'crack' in the hull and not sufficient to sink the ship. While the ES and YM futures have new all-time highs, the NQ futures do not. It would be nice to see the main futures in gear. We'll see if that situation rights itself on Monday and/or Tuesday of next week.

We'll have more to say about the wave count this weekend, but until price loses the 18-day SMA the daily bias is up. It would also be great at some point to see an actual reversal candle pattern on the daily chart, so we'll be on the watch for that. Even though the current action is bullish, the location of the upper band - and the lower low, higher high pattern - makes 'me' very cautious, anyway.

Have an excellent start to evening and the weekend.

TraderJoe

Thursday, February 1, 2024

Above ATH

Today we were counting upward after the possible fourth wave down. First, it was a fourth wave down. It didn't overlap. It hit the lower channel line. Then, after the close today, the ES futures went over the prior high to validate a likely fifth wave higher in the after-hours. The ES 4-hr chart showing the new high is below.


The Elliott Wave Oscillator has turned green and will likely be back above the zero line by tomorrow. In this wave, a reminder in provided that 4,995 is an important level. It is now about 35 points away. If that level is exceeded, then the extended first wave count does not apply any more. If it holds, there could still be a turn within the 13-week turn window. If 4,995 does not hold, the alternate count we showed on Tuesday 30 January's daily chart will apply.

Regardless of any person's market opinion at this point, our count and The Eight-Fold-Path Method did a terrific job of not getting too negative until a fifth wave was seen or not.

At this point, it is only the invalidation point that will tell us what to do. Yes, today was both 1) the first of the month money phenomenon we have pointed out several times in the past, and 2) a slew of large company earnings.

But it is only a valid wave count that gives clear invalidation points to serve as definite anchors for action. Rest assured the Smart Money can count Elliott Waves, too. They know where the invalidation points are too. The problem with bad wave counts is their practitioners don't know where they invalidate. If a wave extends, it extends. It just means that more money is being conjured from a) printing, b) bailing out banks, and/or c) fiscal stimulus.

It is not likely people can set market targets from these fundamentals. Remember, we said that IF the Dow and/or the S&P were to form an ending contracting diagonal then this wave would have to go over the high. It did. That, too, is a benefit of the wave principle.

Have a good start to the evening,

TraderJoe