If we compare the length of the current down wave to the first Intermediate (X) wave in the count, one finds that the current down wave segment is longer than the total height of that prior (X) wave pattern. Here is the ES 3-day chart, so that all prices are included (as opposed to cash which does not necessarily include the maximum travel of the waves).
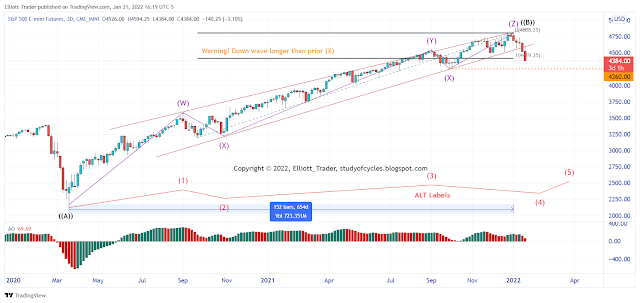 |
| ES Futures - 3 Day - Length Exception |
Such a price movement should get noticed by those Elliott Wave practitioners that are interested in degree labeling. If (and only if) the wedge count of the triple zigzag Primary ((B)) wave is correct, then the wave segment by itself would likely indicate a 'change of degree' as it is a longer wave downward than any prior wave downward.
There are only a few ways I know to 'possibly' rectify the situation. One is with a triangle, possibly as that red Intermediate (4)th wave in Alternate Count. That is because triangles are measured to their (e) waves. Another would be if there was a Flat following red wave (3) in the Alternate count. If the C wave of the flat is short enough that 'the net distance traveled between (3) & (4) is similar to (2)', then the situation might be resolved.
Right now, we can't count a clear triangle. However, this index did stop today at the 78.6% retrace level. So it is something to watch. Same with the Dow futures. But the Nasdaq (NQ) futures and Russell (RTY) futures are well below the 78.6% retrace level, with the NQ near a 98% retrace and the Russell futures already having formally invalidated a triangle. So, the odds of a triangle seem lower than those for a flat, taking all indexes into consideration.
If the down wave should become too large, then it would likely be the first Intermediate wave in the downward direction. We will follow this situation closely.
Have a good start to your weekend.
TraderJoe
Closed under 4400, broke and back-tested the 200, at least 3 overlapping Hindenburg Omen windows in play, opex over. Friendly reminder that 1987 was a Monday after an opex. All we need is an excuse ...
ReplyDeleteES Makes a nice parallel channel on the weekly. Who can they trot out this weekend?
ReplyDeleteNo because where all of the upward Minor waves are located, they are currently shorter than the (W) wave, which allows them to be subwaves by degree labeling.
ReplyDeleteTJ
ES (wkly) - conundrum
ReplyDeletehttps://www.mediafire.com/view/m7vno9x4ctxbd2s/Issues.PNG/file
http://studyofcycles.blogspot.com/2021/11/daily-lower-lows-and-lower-highs.html
DeleteThis chart of Nov 30 shows sub waves of (C) which matches what I see on RSI in my chart above for a wave (iii).
I really don't see the point of going through all of this charting effort to rehash issues we have already discussed: 1) there are two books (Elliott Wave Principle, Prechter & Mastering Elliott Wave, Neely) that suggest if the first retrace wave of an impulse is around 38.2% or less, it 'should' mean that the first wave is the extended wave in the sequence - or else it is an 'A & B' wave, not a '1 & 2' wave up. 2) A lot depends on how the Feb-Mar 2021 correction resolves itself. Is it a 'running correction', is it a triangle? Is it a new i - ii ? This is very, very difficult to say without almost impossible micro analysis, and it might still even be impossible then. 3) Then, what about the extremely overlapping 'potential' diagonal from June - Sep 2021, but which had the shallow retraces? Some very good analysts have it as a diagonal which is the end of a five of a third wave of some degree, but then it never fully retraced. OR, is it the 'b' leg of a triangle like I showed for the Dow's (X2) wave?
DeleteThen, in a typical 'impulse' count is it typical for the RSI to dive below the 50 level for a fourth wave? You would know the answer to that question better than I do.
I'm more familiar with the behavior of the EWO. 'Usually' - most often - in an impulse with an extended third wave the EWO clearly makes a higher high in 140 candles, which it has not done in the 3-day chart with this many candles.
If there is a first wave - with such a short wave two retrace - and an extended third wave forms, then two books are just plain incorrect about this proportion, and a third book is incorrect about the behavior of the EWO.
So again, I do not see the point unless you want to investigate and discuss the RSI.
TJ
Just as a further example, I happened to catch this potential extended first wave in real time on Friday - with the important issue being only the ~38% retrace. Note that wave iii is shorter than i, but, even so, it remains above a 0 - ii trend line. Wave iii - even with less than 140 candles - has a higher EWO.
DeleteThen there is a fourth wave triangle - where the dip for the EWO can clearly be seen, but it doesn't come to the 0 line because there are 'not' 140 candles on the chart. The purpose of the fourth wave triangle is to keep its ((E)) wave from overlapping wave i.
To end the structure, there is a fifth wave that is shorter than iii, and it ends on a divergence with the EWO.
So, I have to ask, if this happens on a 1-minute timeframe, and I can follow it in real-time, then why would the larger scale be different if the waves are fractal?
This is what an impulse with only a 38% retrace 'should' look like according to both Prechter & Neely.
TJ
On your alternate above, you have your (3) at the late Aug peak. This has (3) shorter than (1). Is this why (3) is there by chance?
DeleteYes! Bingo!
DeleteTJ
Sorry, I forgot the link to the intraday example the first time.
Deletehttps://www.tradingview.com/x/IW0b8Ar1/
TJ
For some reason this didn't get posted in Jan 20 comments. Noted your reservations about red (2) being too shallow, which you have mentioned a few times. TJ, what is you take on this slightly different count for your alternate red (1) and red (2), where red (2) is a running flat with b=230%a and c=63%b?
ReplyDeletehttps://imgbox.com/zDlpK5Wt
You'd have to show me how wave 'three' - whatever it is - doesn't break the 0 - two trend line. In the way you seem to thinking, that is still one of the problems.
DeleteTJ
the boxes represent wave restrictions in size, 2 was a failure forecasting the magnitude of upcoming drop. we are in (1) of ((iii)) and it will be extended wave. i have been counting this in real time and especially paying attention to sizes of waves and lack of overlap even though it appears at times there is overlap. im assuming you find violations but its valid count by my standards until you can convince me otherwide thanks
Deletehttps://www.mediafire.com/view/o4e15frmkn5vyem/ct.jpg/file
i will add that my quant models have next 2 days as possible bounce, but im willing to wait for evidence before dismussing this count
Delete@marc .. why are you replying to a topic with a response that has nothing to do with it?
DeleteTJ
Well... I thought that response was to my post about nested nature of market, it seemed to be a nice response, now I see it's not right thread
Delete..yeah I've thought of that one, but then the Dow breaks its 1.618 external Fib retracement from the Covid low? Possible if there is a failure, perhaps. I liked the idea of ending with a triangle or diagonal, but so far a diagonal has been invalidated, and a triangle invalidated in the RTY (likely the NQ, too). SO, I'm OK if it ends like it does.
ReplyDeleteTJ
CRB - 3PDh -
ReplyDeletehttps://www.mediafire.com/view/riwtr3p4b2wxqz9/CRB3PDh.PNG/file
XLY/XLP - 3PDh - A couple of observations you may find of interest -
https://www.mediafire.com/view/7dv4miwrrhro9hc/XLYXLP3PDh.PNG/file
BTC (wkly) Exp. flat? (click to sharpen)
ReplyDeletehttps://www.mediafire.com/view/bahf8swhgdg1u99/BTCflat.PNG/file
BTC count__ I am struggling with the A wave down Having the LOOK of 5 waves down. Is there a case in a Flat where the A wave can be 5 waves? I am under the assumption it should be 3 waves. Notice in the chart price has entered the center channel down.
Deletehttps://www.tradingview.com/x/h79X2aor/
@MDE: I'm no Bitcoin analyst but how sure are you that the up wave is 'definitely' the B wave of an Expanded Flat? Using 12-hour bars and the EWO, there is a case to be made that this wave is a non-overlapping 'five' and not a 'three' because the EWO did come back into fourth wave territory.
Deletehttps://www.tradingview.com/x/K15VHJOf/
I just don't see how it 'has to be' counted as a 'three'. Was this wave clearly looked at, or is it just a 'casual glance' at the weekly chart?
Joe, very interesting in Es futures. Measurements. Note how the lengths of waves allow for nested 1s and 2s. And overlaying ewa also fits nicely, indicating only in the third of third and subdividing. This is about point in wave where last 10 years we get a hard to count is it a 3 or 5 down wave, and at least be aware that wave has proper measurements to continue lower, thus a psychological shift as well as a degree change
ReplyDeleteInterestingly, on the wkly ES (2) or (X) does not touch the 34ema below. This last week is first touch since mid June of '20 [TradingView] (fwiw).
Deletehttps://youtu.be/3eG3jzLkUR4
ReplyDeleteA follow up to my post yesterday from Martin Pring.
Inflation to lead stocks higher? Raising rates isn't going to stop inflation caused by supply chain issues.
I wanted to clear up my last line. Last year wall Street journal had an article stating raising rates doesn't slow inflation created by supply chain issues ,( wish I could find that article). After watching Martin Pring, I wonder if we are late cycle bull market? Anyone know how I can find that ticker UBS us 30 y yield Martin is showing? John Murphy uses that as well.
DeleteES (2day) Posited exp. flat targets +
ReplyDeletehttps://www.mediafire.com/view/snoxkbewot7bq8e/flattargets.PNG/file
I haven't seen a gap in qqq, I don't think spy has a gap. Maybe markets open gap down for middle of 3.
DeleteVolume for spy was just over 1/2 billon last week. I'll post my chart buy & hold or buy & sell by Markos later today
@Bill.. SPY has a gap??
Deletehttps://www.tradingview.com/x/fQNLxcq3/
TJ
Likely talking about a high/low low/high gap, which there isnt one that I can see. Just a guess.
DeleteGW yes ET thank you
DeleteIn a brief diversion from Elliott Wave I happened to find this short succinct summary of the current NYSE order-execution landscape.
ReplyDeleteSummary of NYSE Market-Making
One item I found interesting is confirmation that when markets get volatile, "liquidity" can just 'dry up'. Meaning, sometimes people, traders, investors, companies, algorithms just 'withdraw' bids and offers. So, I take from this that volatile markets do not necessarily show increasing volume. But bid-ask spreads increasing might be a sign of the volatility.
TJ
Thank you for linking to this paper, Joe. Great observation, too.
Deletehttps://imgur.com/zdBXoi1
ReplyDeleteBuy & Hold or Buy & Sell by Markos Katsanos July 2021. Markos created this to avoid large draw downs during bear markets. I’ll highlight his sell rules:
Vix should spike more than 100% or the ATR should be up more than 200% during the last 15 weeks.
Net price decline from the highest price during the last four weeks should be more than 6%.
Highest value of the stochastic indicator during the last 4 week should be above 85.
Closing price should be below its 20 week ma
Volume should be 180% or higher that its 50 week moving average.
SPY - 3 channels update -
ReplyDeletehttps://www.mediafire.com/view/h5c59156xya4mbb/3channelsUpdate.PNG/file
BTC futs - possible paths (click to sharpen) comments welcome
ReplyDeletehttps://www.mediafire.com/view/phe3a8lq32oi0eg/BTCFuts.PNG/file
Why is everyone doing the same thing, and 'assuming' x or b at the top? Count?
Delete@MDE: I'm no Bitcoin analyst but how sure are you that the up wave is 'definitely' the B wave of an Expanded Flat? Using 12-hour bars and the EWO, there is a case to be made that this wave is a non-overlapping 'five' and not a 'three' because the EWO did come back into fourth wave territory.
https://www.tradingview.com/x/K15VHJOf/
I just don't see how it 'has to be' counted as a 'three'. Was this wave clearly looked at, or is it just a 'casual glance' at the weekly chart?
TJ
Agree completely with this count, the 5 was short. The problem is everyone expects another rally like 2017, with a large explosive rally and huge topping candle. However, 2017 was likely the 3 wave and now the 5 is done.
DeleteThanks for discussion I am not set in my Flat count, and I still have A LOT to learn in Elliott. That was my first mention of the flat label and I had posted this chart a few times..Elliott is the graphical display of mass psychology, The BTC "mining" investment, news stories with banks and governments ,localities, politicians athletes seeming all in on bitcoin to me says major top was made a few months back and now we watch as we see 3PDH?, H&S?, and its continuation down the Channel and taking out support levels this collapse could be historic. And Wow SPY getting crushed.
DeleteSPXcfd - have hit today's pivot (above). Friday's daily pivot around 4483, with this week's just above at 4500ish.
ReplyDeleteEURJPY (dly) - An aside Two 3PDhs in play, one fully retraced - (if interested)
ReplyDeletehttps://www.mediafire.com/view/h8xaq22t94cheaw/EURJPY.PNG/file
ES 4-hr: has hit the 1.618 Fibonacci extension and exceeded it a bit.
ReplyDeletehttps://www.tradingview.com/x/qTvAeUI4/
It's possible to go lower, as the internals of the third wave do not look quite complete (i.e. ((iii)) of 3?).
TJ
2.618 ext for SPY at 414, looks likely and fast!
DeleteNQ futures (daily) - have broken the Oct daily low, and 'currently' have 18-SMA cross lower under 100-SMA (bear cross).
ReplyDeleteTJ
Only up count left is this is 3 of c for a flat on the daily?
ReplyDeleteSPY has taken out the Oct low; not the ES, so far (but likely).
ReplyDeleteTJ
ES has now taken out the Oct low.
DeleteTJ
ES - we've hit the 2.00 extension of 'a' from 'b' in poss exp. flat. The 2.618 extension is confluent with .618 expansion of 'a', in the 4050-4090 area.
ReplyDeleteSPXcfd (dly) Posited exp. flat progress
ReplyDeletehttps://www.mediafire.com/view/kv50996p0559bcm/flatprogress.PNG/file
GLD (2day) - Surely not (?)
ReplyDeletehttps://www.mediafire.com/view/wqqfd8udvn3aai7/GLD.PNG/file