Monday, January 31, 2022

'Smart Money' Rules

The daily chart of the ES futures has the 18-day SMA ('the-line-in-the-sand) crossing down under the 100-day SMA.

ES Futures - 1 Day - 18 Cross 100 SMA

If the Smart Money rules, and to some extent they do, then the combination should offer some resistance to upward price movement. While no harm has been done to a fourth wave count (yet), odds of an impulse got a little lower with today's move up. And, the odds of a diagonal increased a bit. Neither can be ruled in or ruled out at this time. 

Price is also back up to the potential horizontal resistance from the December 2021 lows. Remember, tomorrow is the first trading day of the month - and often that brings the usual inflows, although some of that might have been seen today depending on specifics of the timing of roll-overs, etc.

Have a very good start to the evening.

TraderJoe

Wednesday, January 26, 2022

Reasonable - 2

Now with about 110+ candles on the SPY hourly chart, the current count is still shown as a 'reasonable' fourth wave, 4, at the 38.2% retrace level.


The internal count of wave 4 is likely a double or triple zigzag. It is difficult to say. And, if it is the triple zigzag, it could also be a very poorly formed leading diagonal.

Therefore, the main count is shown in black as the channel count. Right now the channel is holding well, and red volume surged on the FED FOMC meeting outcome. The EWO characteristically poked above the zero line, too, well within its parameters of +10% to -40% of the prior trough.

So, the same procedure applies as yesterday: 1) a 'wave-counting-stop' is placed above today's high. As long as that stop is not hit, then it is more likely that wave Minor 5, downward, is under construction. 2) IFF the stop is hit then a re-evaluation is needed, including the potential alternate count shown in red of an expanding diagonal.

(Regarding the alternate: the concern for the diagonal arises because the internal structures of waves 1 & 3 might be three-wave-sequences. The count on these two downward waves is not as straight-forward as one would like - including the location of the wave three gaps.)

Have a good start to the evening.

TraderJoe

Tuesday, January 25, 2022

Reasonable

If we use 45-minute bars on the SPY cash chart to get 120 - 140 candles, we get a 'reasonable' fourth wave location and approximate 38.2% retrace.

SPY Cash - 45 Minutes - Possible 4

It's very possible wave 4 is a failed double-combination ((w))-((x))-((y)) wave. If so, such a failure would typically be bearish. It is still possible for the Elliott Wave Oscillator (EWO) to come closer to the zero line.

The best alternate I see would be that only minute ((iv)) of Minor 4 ended at today's high. I would put a 'wave-counting-stop' above today's high, and monitor the overnight to see how much of the latest downward wave is retraced in the overnight.

There could still be some news developments (Russia, earnings?) that makes an even more extensive fourth wave (either in price or time), but it should be clear that green volume faded during the session, while red volume increased at the end of the day. So don't let emotions get in the way of good, sound analysis. Remember...only the market is correct.

Have a good start to your evening,
TraderJoe

Monday, January 24, 2022

Gap & Fill

I have written before in regard to degree labeling that stock indexes rarely make 2.618 waves in typical impulses, although they do sometimes in diagonals and triangles. That was the case today. Stock indexes & futures made a new low below the October 2021 low around a 2.236 extension, and then reversed. The daily chart is below.


Ira Epstein (broker with the Lind Group) might say (paraphrasing), "There were four consecutive closes below the lower daily Bollinger Band, and the probability of a fifth consecutive day has very, very low odds - around 1 - 2%". That wisdom proved itself today, as well - with prices closing just inside or perhaps right on the band.

The up wave is likely at least a portion of a fourth wave - given its size. The question for an impulse is whether the 50% retrace of the third wave is respected or not. If it is, or perhaps if the fourth wave forms a triangle, then an impulse wave, downward, might occur.

But I do have some concern about the internal wave labeling, and it is possible the downward wave might turn into a diagonal. So, we'll be watching the wave in the next couple of days to see how the count develops. Again, right now an impulse is still possible, but let's see if that develops or not.

Also worth noting - at a low of 4,212 the down wave came very close to the 38.2% retrace from the Sep-Oct 2020 low! That level in the futures is at 4,193 - 4,203, depending on which trough you use for the anchor.

Given that, it should be clear how the market makers are 'jerking the market around' getting close to levels and not making it, etc., making gaps and not following-through, etc. I have no beef with this, it is 'market survival time' and it is likely the powers-that-be are taking extraordinary measures to see that this occurs. There is no other way to comprehend it. The market makers are using your account and my account information (balances) and market-making-algorithms, that I wrote about yesterday, to make sure that the landscape is as difficult to understand as possible - and to maximize their profits at the expense of retail.

One just needs to be aware of this, and not get emotional about it, because as Ira clearly indicates in his videos there are a lot more algorithms using statistical and numeric (account balance & position size) information to run the market than programs using Elliott Wave counting. And using Bollinger Bands is a coarse example of it.

So, now we need to see if an impulse forms or is invalidated, or if a diagonal forms or is invalidated.

Have a good start to the evening.

TraderJoe

Friday, January 21, 2022

Length Measurement

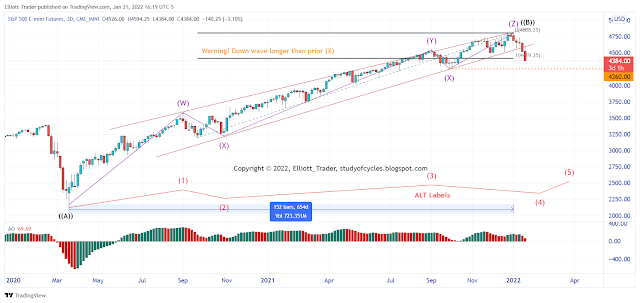
If we compare the length of the current down wave to the first Intermediate (X) wave in the count, one finds that the current down wave segment is longer than the total height of that prior (X) wave pattern. Here is the ES 3-day chart, so that all prices are included (as opposed to cash which does not necessarily include the maximum travel of the waves).

ES Futures - 3 Day - Length Exception

Such a price movement should get noticed by those Elliott Wave practitioners that are interested in degree labeling. If (and only if) the wedge count of the triple zigzag Primary ((B)) wave is correct, then the wave segment by itself would likely indicate a 'change of degree' as it is a longer wave downward than any prior wave downward.

There are only a few ways I know to 'possibly' rectify the situation. One is with a triangle, possibly as that red Intermediate (4)th wave in Alternate Count. That is because triangles are measured to their (e) waves. Another would be if there was a Flat following red wave (3) in the Alternate count. If the C wave of the flat is short enough that 'the net distance traveled between (3) & (4) is similar to (2)', then the situation might be resolved.

Right now, we can't count a clear triangle. However, this index did stop today at the 78.6% retrace level. So it is something to watch. Same with the Dow futures. But the Nasdaq (NQ) futures and Russell (RTY) futures are well below the 78.6% retrace level, with the NQ near a 98% retrace and the Russell futures already having formally invalidated a triangle. So, the odds of a triangle seem lower than those for a flat, taking all indexes into consideration.

If the down wave should become too large, then it would likely be the first Intermediate wave in the downward direction. We will follow this situation closely.

Have a good start to your weekend.

TraderJoe

Thursday, January 20, 2022

Long Term Wedge Has Clearly Broken Down

On the ES 3-day chart, below, the lower boundary of the long term wedge has clearly broken down.


Note that not all of today's futures prices are shown as of this writing futures are below 4,440. That's quite a switch from 4,808 in just a couple of weeks. Keep your eyes on the length of this down wave as it might become longer than the first Intermediate (X) wave.

I'm showing the alternate count as a schematic below prices. As I noted in the Sunday January 2, update, there are issues with the count that make it the alternate at this time.

I will be interested to see if the market can make a full 1.618 x 1 wave down.

Have an excellent start to the evening.

TraderJoe

Tuesday, January 18, 2022

Measuring Expanded Flats & The Fourth Wave Conundrum

While we are waiting to see if any new daily fractal lows are made today, a lot of interest has cropped up around the proper way to measure Expanded Flats. This is probably because of a number of Elliott Wave sites who are projecting expanded flats from the high. So, because their sites claim there is an Expanded Flat in progress, people think they can badger me to complete the work others are not showing you, rather than badger them! This is clearly quite rude, but emotions do not run this blog. The Elliott Wave does. People want this education for free, and they don't even want to have to read a book so that the education sinks in and becomes a part of their second nature. Too bad for them. Well, here it is.

S&P500 Cash Index - Weekly - Expanded Flat

First some definitions:

Regular Flat - A regular flat 'always' starts with three-waves-down to (A), as shown above, as A,B,C on the left. In a Regular Flat the (B) wave remains with a zone of 90% to 105% of the length of the (A) wave. This example is not shown above. The above example is for the Expanded Flat, below. The (B) wave must occur as a 'three', either as a zigzag, multiple zigzag or in rare instances a Flat, itself. Again, the (B) wave will stay within 90 - 105% of (A), but it must make the 90% level by Elliott wave 'rule'. In such cases the expectation is that the (C) wave, not shown above will just be (C) = (A) or very close to it. In such cases, the (C) wave barely pips under than (A) wave.

Expanded Flat -  The term 'expanded flat' means the (B) wave is 'greater than the 105%' expected in the regular flat wave. This is because the market forces were extraordinarily strong during the rise, as with a QE program, reduction of interest rates, etc. propelling the market initially higher. In compensation, the (C) wave is expected to 'expand' greater than a typical (C) = (A) to make a meaningful correction to the price movement. An expanded flat must 'also' start with just three waves down, as A,B,C on the left in the above chart. Then, the (B) wave in three waves 'must' exceed 105%. In the case shown above, the (B) wave just pips over the 1.618% level in three waves, shown as A, triangle-B and C up to the (B) wave before the (C) wave down takes over.

Measuring Expanded Flats

  1. Because the term 'expanded' is used in the flat, one uses the Fibonacci expansion ruler, and NOT the Fibonacci retrace ruler.
  2. The 'anchor point' or 'origin point' of the ruler is placed at beginning of the (A) wave, the red 0, shown above. 
  3. The measurement of the (A) wave is taken, with the first point, the red 1, shown above, at the end of the (A) wave. This is shown with the dotted line down to the 1, although the dotted line is offset slightly so you can see it. In reality, you will hit the low of (A) exactly, and if your software allows, actually anchor the point on the end of the (A) wave.
  4. Next, the Expansion Point, shown as red 2, is drawn out to the (B) wave high at 3,394. Again, the dotted line to 2, is offset so you can see it. In reality you will hit the end of the (B) wave exactly, and anchor on that point if your software allows.
  5. The projection of (C) shown as point red 3, is then given by the Fibonacci extensions that travel downward. As the whole purpose of the Expanded Flat is to make a deeper correction than the (C) = (A) of a Regular Flat, one looks for the most common Fibonacci extension points beyond the low of the (A) wave. Those points are 1.618 x (A), subtracted from (B), 2.00 x (A), subtracted from (B) and 2.618 x (A), subtracted from (B). These are all common Fibonacci ratios.
  6. In the example above, the (C) wave stopped at 2.00 x (A), subtracted from (B), an acceptable result.
  7. In the example above, it should be clear the 1.618 expansion, also shown above, would not have resulted in a new low beyond the (A) wave which is the whole mission of an expanded flat. Therefore, one looks to the next Fibonacci level ratios to see where an ending point might be.
  8. CAUTION: there is no Elliott Wave rule that states what the length of the (C) wave will be. There is only a general guideline for flats that (C) will be between 100% x (A), and 165% x (A) and it is based on the authors' experiences to that point in time when the rules were written, and primarily on the Dow Jones Industrial Average. The above chart is of the S&P500 which includes the greater volatility from a high proportion of tech stocks.
What does this say about the current market environment? Here is a four-hour line chart of the ES futures on a close only basis. 

ES Futures - 4 Hr - The Fourth Wave Conundrum


The very first thing to note is that the left-hand side 'can be' counted as three-waves-down. Then the up wave travels to close to the 1.382 external retrace on that potential (A) wave or (X) wave down.  But the up wave can also be counted as a 'five', or as a 'double-zigzag'. This is very, very hard to tell. Regardless, if it is a 'three' it can be a (B) wave. But if it is a 'five' then it could end the wave sequence upward. Again, this is very, very hard to tell.

Yet, most importantly, the current down wave has not exceeded the 78.6% level needed to help distinguish a triangle from an expanded flat. Maybe it will exceed 78.6%, maybe it will become an expanded flat. Maybe it will triangle instead. Maybe it will far exceed the limits expected of an expanded flat and indicate a top.

This is all part of what I have termed The Fourth Wave Conundrum. This is a period of time, starting with a wave sequence which begins with only three-waves-down, and during which any type of one of the 13 common fourth wave structures sideways can occur (including various flats, triangles and/or combination waves), or during which an ending diagonal, upwards, can occur. Everyone wants to know what the wave count is. They ask and they pester. They get testy. I get it. Their money may be at risk. But what they don't understand is that this is the market's way of insuring there is risk in the count and in participating in the market. IF there were a 100% certain answer, the participants would win every time, and the market would cease to be a market.

Tip: don't struggle with bad software. Make sure your Fibonacci rulers can anchor on the end points so that you get precise measurements.

Snapshot of Fibonacci Expansion Tool on MotiveWave platform (also including Retrace, and Extension tools.)


Have an excellent start to the day.
TraderJoe


Saturday, January 15, 2022

DOW has touched 1.618 - Just Saying

Here is a way to get the Dow at the 1.618 external retracement of the March, 2020 Covid-19 down wave. Yes, there might be way to convert this to a five wave count if certain things happen. But right now, those additional waves (the 'certain things that might happen') are not in evidence.


Because of the large number of overlaps since May 2021, an impulse count may have difficulty. Further, there would be numerous breaks of a 0 - 2 trend line in a third wave. Note than in this count there is alternation between both of the (X) waves. The first (X) is a simple zigzag. The second (X) is a triangle. This might be the count if the 1.618 external Fibonacci retrace is the limit.

Have an excellent rest of the weekend.

TraderJoe

Wednesday, January 12, 2022

Contracting Diagonal Limits Now Available

Earlier in the day this chart was posted. If we are in a contracting diagonal upwards, these limits may now be calculated for the move. The limits are now possible because we can count a five-wave-sequence up from the low (see the second chart, below). This chart uses the SPY 8-hr time frame.

SPY Cash Index - 8 Hr - Potential Diagonal

In a contracting diagonal, wave minute ((v)) must be shorter than wave minute ((iii)). That means the limit for the up move if it is to be a diagonal is at 487.64 basis SPY. Right now the other wave lengths are acceptable. Wave minute ((iii)) is shorter than minute ((i)), wave minute ((iv)) is shorter than wave minute ((ii)) and wave minute ((iv)) overlaps wave minute ((i)). While wave ((ii)) is just short of a 62% retrace in the SPY, it is not in the Dow. Further, in the SPY wave ((iv)) is greater than a 62% retrace.

Further, we now know the down side limit for wave minuet (b) of minute ((c)), it may not travel below the low of wave minute ((iv)). If it does, and there is not a new high first, there is a potential for wave minute ((v)) to fail.

The ES hourly chart can currently be counted as being in five wave to wave minuet (a) with the first wave as the extended wave in the sequence, as follows.

ES Futures - 1 Hr - Likely Wave (a)

Whereas today's down move appears to be in three waves. The down move has already traveled wave to the wave iv of one previous degree, but keep in mind that "b" waves can be tough to nail down. For example, with three waves down, the (b) wave could be a triangle, or it could be a flat to take more time relative to the up wave. More insidiously, the (b) wave could drop further in a grinding double or triple zigzag, making it more difficult to gauge. It is suggested that the Fibonacci retracement levels might be a useful aid to help determine if an when the down move is over.

Once again, price may not move below the low shown on this chart and still maintain a count of a contracting diagonal upward.

Have an excellent start to the evening.

TraderJoe

Tuesday, January 11, 2022

Back to the 'Line in the Sand'

Today we counted the ES futures as having 'three-waves-up' from the recent January low, making it back to the vicinity of the 18-day SMA, the 'line-in-the-sand', after tagging the lower daily Bollinger Band. The daily chart is below.

ES Futures - Daily - Back to 18-day SMA in Three Waves 'So Far'

It is too early to conclude anything. If the market can add a fourth and fifth wave up, an impulse would likely result. The daily slow stochastic, which was embedded - but lost its embedded status - has worked off the over-bought condition and is currently neutral.

The upward count remains an overlapping contract diagonal (that we have shown the basic form of in earlier posts. See this LINK.) which can easily still play out. The measurements remain correct for such a count. The only downward count I can see would be some sort of diagonal because from the all-time-high there is three-waves-down and now three-waves up. This count might apply if prices find stiff resistance at this level.

A downward count might morph into a ((i)) down, and flat ((ii)), up, but only if the all-time-high is not exceeded with five-waves-up. However, this is a lower probability count at the moment as trading over the 18-day SMA might turn the algorithms to shoot for the upper daily Bollinger Band.

So, in essence, price is in no-man's land from a wave-counting perspective, and clarity is needed on the count. It is hard to defend any particular count in such a situation except to say that some major market tops are often accompanied by a contracting diagonal, or a contracting diagonal with a failed fifth wave. In this case such a diagonal would have been literally months in the making.

For the local count of three-waves-up, see the comments for the prior post at the end of the cash session.

So, with that in mind, we take it wave-by-wave. Have a good start to your evening.

TraderJoe

Saturday, January 8, 2022

Will the US Dollar Impulse or Not?

With five-waves down in the ES futures (waiting on a potential retrace or move up), I thought we'd have a look at the US Dollar Index futures today. Remember, we called a low in this index in 2021. That low has not been broken. Below is a chart with 132 bars, each of which represents 2-days. The 132 bars is used to agree with The Eight-Fold-Path-Method for Counting an Impulse, requiring between 120 - 160 candles for 'The Wave of Interest'.

US Dollar Index Futures (DX) - 2 Day - Sideways

For about the last month-and-a-half, since the high labeled Minor 3, price has been consolidating sideways. Of interest, this move may have started with a contracting leading diagonal according to the signature from the Elliott Wave Oscillator (EWO). Note the declining and diverging peaks as price moves forward and the contracting pattern of waves minute ((ii)) and minute ((iv)), and the overlap of waves minute ((iv)) and minute ((i)). Then, the EWO sprints to a higher peak, and is now declining. This could represent waves Minor 3 and Minor 4. 

If so, then only one higher high in five waves is needed to complete an impulse wave to the upside. Yes, there is a risk of overlap of wave 4 on wave 1, so that needs to be watched for. But, if overlap is avoided, we think the pattern might be able to make an Intermediate (A) wave up, until there is a substantial retrace lower.

Keep your eyes on this one, as a spike up might come on increased interest rates and/or be simultaneous to a drop in Gold.

Note: The Eight-Fold-Path-Method for Counting an Impulse is the featured post on this site, in the upper right-hand corner of the main blog page.

Have an excellent rest of the weekend. 

TraderJoe


Thursday, January 6, 2022

Consolidation near the lows

After yesterday's outside key reversal day in the DJIA, markets lost a few more points by the close today.  This appears to be simple consolidation in a likely wave four. Examination of the ES hourly chart shows an initial stab at a 0.382 retracement was made early in the morning. Then, there was a lower low (which might be the 'b' wave of a flat fourth wave), followed by a more earnest & successful attempt to attack the 0.382 retracement level. Below is the ES hourly chart.

ES Futures - 1 Hr - Downward Channel


The down wave at (iii) is 2.618 x wave (i). This is pretty rare except inside of diagonals (which I think we are in) and triangles. If the up wave (iv) is complete as shown, then it can count as w-x-y to (iv).  If wave (iv) wants to extend a bit to try to press in to the 0.50 retracement level, then it can count as a potential a-3, b-3 and contracting diagonal c-5.

IFF a new low occurs, then it is likely we have a minute ((a)) wave down. Let's see how it goes.

Have a very good start to your evening.

TraderJoe

Wednesday, January 5, 2022

Outside Key Reversal Day for Dow

The DJIA had an outside key reversal day down, after making a marginal new high. The ES and NQ futures did not. The Dow's wave minute ((iii)) pushed it right to the limits of equality today, but did not exceed such.

The down move occurred when the FED's FOMC prior meeting minutes were released. They seemed to indicate a more aggressive Fed on inflation.


The potential contracting ending diagonal pattern has a better chance of playing out today. It is expected, but what if it doesn't? What if wave ((ii)) is broken to the down side first? Then, the waves may be counted as in the red alternate count A, B, C to Intermediate (Z) of Primary ((B)).

Let's see how it goes. Have an excellent start to your evening.

TraderJoe

Tuesday, January 4, 2022

Two Views on the Dow

The preferred count is first. The third wave just held inside of 100% times the first wave. The pattern has the 'right look' to it with a nicely deeply retracing second wave and interior 'three-wave' sequences.

DJIA - Daily - Diagonal?

In the second chart, below, the alternate, the triangle looks "cut-off" in other words, price hasn't traveled very far towards the apex of the potential triangle lines.


DJIA - Daily - Triangle Alternate

Yet, there is already a higher high. Therefore, it is the alternate at this time. 

Have an excellent start to the evening.

TraderJoe

Sunday, January 2, 2022

Year-End Review of S&P500

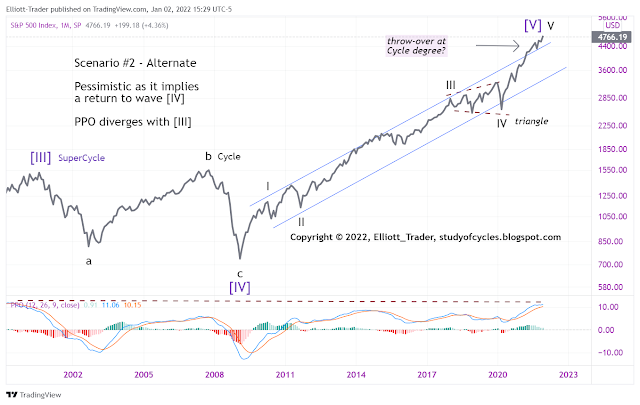
The first scenario is 'as counted' and is the most optimistic as it implies a SuperCycle Wave [IV] yet to form that could be either primarily sideways, or make a new high, after a significant (62% - 78%) downward correction.

S&P500 - 1 Month Closes - As Counted

It assumes that SuperCycle [III] has already been made, as have the first Primary ((A)) wave down as shown above. This scenario has going for it that 1) all wave degrees have been accounted for and there are no degree violations that I can detect, and 2) while the PPO for the Primary ((B))-3 wave looks out-of-line with recent waves, it still currently diverges with the PPO from the year 2000 top. (Note: the PPO is often used in place of the MACD when log scale charts are used over a multi-year time frame.)

The second scenario is much more pessimistic.

S&P500 - 1 Month Closes - Alternate


This scenario assumes the whippy movements from 2018 to 2020 were part of an expanding triangle which should indicate 'last wave directly ahead'. Some difficulties with this scenario are that 1) Neely indicates he has never seen an expanding triangle in a fourth wave position, 2) there has been no five-wave movement down from the high yet to prove even a Primary wave, downward, let alone a Cycle wave downward, 3) there 'may not' be alternation in waves II and IV as they both have higher internal waves, although wave IV's triangle did not fail to make a lower low as wave II's wave did, 4) it is very hard to distinguish on this scale where the Primary waves would be within the Cycle waves up to SuperCycle V, and Fibonacci 5) there are degree-labeling problems both within the Cycle c wave down to SuperCycle [IV], and within the Cycle III wave up within SuperCycle [V].

In favor of the second count, this SuperCycle [V] up wave could have divergence with the PPO from the SuperCycle Wave [III] if it formally curls over. And there could be a throw-over of a Cycle degree trend channel.

Finally, a reminder that Monday is the first trading day of a new month and a new quarter which often, not always, sees inflows from pension funds, 401k's, company bonus plans, dividend reinvestment plans, etc.

Have an excellent rest of the weekend.

TraderJoe