 |
| SP500 Three-Day Chart using The Eight Fold Path Method |
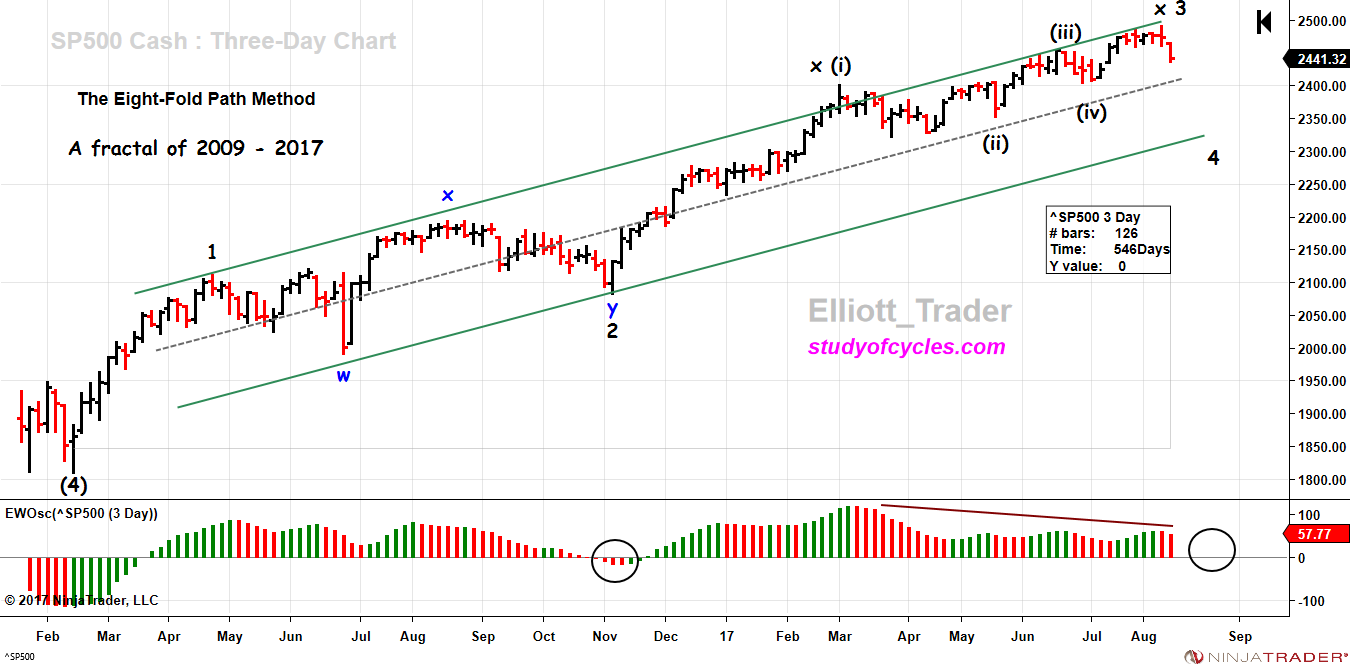
Here again. Remember, the first step in the method is to pick the time frame that provides between 120 - 160 candles on the chart for the wave of interest. So, in this case, that is the "three-day" chart. The ruler and its flag, shows that this time frame now provides 126 candles on the chart - right in the ballpark for our analysis. I need to emphasize this point because some people only adamantly want to analyze the daily chart, or they only want to analyze the weekly chart. Those selections are fraught with problems. They do not recognize that the market is fractal with regard to time, as well as with regard to price.
Now, some people don't even have the software that allows them to do this. But, yes, there is free software, as above, that can do it for you. Oh well. You can lead a horse to water, as they say...
Next, we plot the Elliott Wave Oscillator, and note where it's high point is. The high point will always be in a third wave of some type when you are counting an impulse - just as it is here. In this case, the high point is on wave minute (i) of Minor 3 because within Minor 3, the first wave is the extended wave in the sequence. You can clearly see, that this is where the "kick-off" momentum is, and where there are the most vertical bars. And, further, as we indicated in prior posts and videos, there is no retrace within Minor 3 that is greater than 38.2% - and this is a hallmark of an extended first wave.
But still, the high point of the EWO is within Minor 3, and overall, we know that Minor 3 is the extended wave in the sequence, as it is now longer than Minor 1. So we denote the extended minute first wave within Minor 3 as x (i), meaning it is the extended first wave. And since Minor 3 is the extended wave, it is denoted as x 3. When the first minute wave is the extended wave, then, by definition, wave minute (iii) and minute (v) must be shorter than minute (i), and they are. And, specifically, minute (v), not labeled at the end of Minor 3, must be shorter than minute (iii), and it is.
Next we expect the fifth wave, (v), within Minor 3 to be on a divergence with the EWO, and clearly it is. So, now we would fully expect a wave to form in the downward direction such that EWO will come back to within +10% to -40% of the highest reading within the third wave. Given that this is a three day chart, it may require a few weeks to do that.
The next step in the process is to draw a line from wave 1 to wave 3, and then indicate the channel by drawing the line parallel to it from the second wave, Minor 2. As we expressed in the last few weeks, it is essential to draw this channel so that no part of a line drawn from (4) to 2, cuts off any part of a third wave. This is a guideline from Glen Neely's work in Mastering Elliott Wave, and we want to fully credit him with it. If you dig in to the details, you can see that the minute (ii) location is also the only location that allows this guideline to be met within all of Minor 3.
The purpose of the fourth wave lower, Minor 4, is to attack the lower channel, and to provide some alternation with the second wave in the sequence, Minor 2. So, to get down to that channel, wave Minor 4 may either be a zigzag, a zigzag that starts a triangle, or a multiple zigzag. This is because wave 2 was a "running flat" wave, and a "running flat" predicts a strong up move after it - which it did. And only a sharp or a triangle can alternate with a flat.
Within certain limits, I can have no preference for how wave Minor 4 occurs. This is part of what I have termed The Fourth Wave Conundrum. Fourth waves are inherently unpredictable, except perhaps as regard to depth of the correction, and or alternation. But, that's about it.
In terms of depth of the correction, 38% - 50% of wave Minor 3 is most common. And that provides a range of about 2250 - 2300. Again, if wave 4 forms as a simple zigzag, then wave 5 might expect to be an ending diagonal. And if wave Minor 4 forms as a triangle, then Minor 5 might be one that is a simple quick thrust out of such a triangle. We'll have to wait and see how that occurs. While it will be interesting, it may be frustrating for traders who try to play the choppy waves that might develop. Remember the very purpose of a fourth wave is to get people to surrender some of their hard won profits from wave Minor 3. And that is probably happening to some already.
I always try to provide an alternate when I see one, and I have already done that several times, but again, there is no evidence for the alternate at this time. The alternate, to refresh people's minds is that 1,2,3 is really only A,B,C of Intermediate (1) of a much larger fifth wave diagonal. The first evidence that such an alternative would be activated is that the 4th wave became larger than 50% x Minor 3, and / or that the Elliott Wave Oscillator (or EWO) went below the level of -40% of the highest point of wave 3. Again, neither of those are in evidence.
So, with that in mind, we remain on The Eight Fold Path, and wish you and yours a wonderful weekend.
TraderJoe
Hello Joe
ReplyDeleteAgain thank you for all you do!
I would like to ask you something about the alternate of which you speak here: “I always try to provide an alternate when I see one, and I have already done that several times, but again, there is no evidence for the alternate at this time. The alternate, to refresh people's minds is that 1,2,3 is really only A,B,C of Intermediate (1) of a much larger fifth wave diagonal. The first evidence that such an alternative would be activated is that the 4th wave became larger than 50% x Minor 3, and / or that the Elliott Wave Oscillator (or EWO) went below the level of -40% of the highest point of wave 3. Again, neither of those are in evidence.
Could you somehow see a possible wave structure whereby (after this Minor 4 down, turns out to be the 2 of the larger fifth wave diagonal or something else), a real hyperinflation starts to show up in the charts? Along with a “crashing” dollar?
(a hyperinflation would be more in everything we need and use, so it’s really more in physical stuff I guess, but it could also show up in the charts? Look at Venezuela)
I ask this because for some years now, I am expecting a real hyperinflation to end all this madness of money creation and maybe it could be seen in the charts first?
Thank you
Koba
Hi Koba. Welcome. As I have stated before, I do not think the market path is preordained. Anything can happen based on the actions of people. But, I do think the market is a "self-correcting process" in which the excess actions of people is eventually corrected by price.
DeleteSo, from the founding of the FED, until now, there has already been sufficient inflation created to drive the value of the dollar down to 5 cents (or less) in constant dollar terms. If this wasn't hyperinflation, I don't know what was. A car that used to cost $3,000 now cost $30,000. And a house that used to cost $30,000 now costs $300,000.
That inflation has 'already' shown up in the charts of the DJIA which was a 40 in 1932, and was recently at 22,140! The U.S. is already at $20 Trillion in debt. This is a number so large that no one knows what it actually means. And you can add the $4 Tril that the FED holds on it's balance sheet, plus the Social Security and Medicare program debt which is "off the books".
Aren't numbers in the Trillions (or much more) exactly what people expect when they speak of Weimar Republic, Hungarian or Zimbabwe-type of hyperinflation?
Is it possible that this hyper-inflation has been experienced the way that the proverbial frog experiences the pot of tepid water on the stove that eventually reaches the boiling point of no return?
You see. All of these opinions are 'possible'. And that is why I do the opposite of what you did in your note. In your note, you state your opinion first, and guess what wave count results from it. You basically say, "hyper-inflation will result in a wave 2".
What I do is leave my opinion at home and use a specific market based methodology to tell me what wave is most likely coming next. These are two very different approaches.
Yours 'might' be useful in the long term (month? years?). That remains to be seen and will be difficult to verify because it is years in the future.
Mine is oriented at the short-to-intermediate term, with a better ability to verify the results within a few weeks or months.
Salut joe Merci pour ton commentaire
ReplyDeleteLa phase 4 doit durer combien de temps ?
Thanks again Joe for your analysis. I totally agree with your evaluation of our county's current financial state even though it doesn't influence your ew methodology--but it's always lurking in the back of my mind. Something to think about for sure. You are the man!
ReplyDeleterose
Great analysis. Thanks for posting!
ReplyDeleteWelcome, lew. And thanks for saying.
DeleteThanks TJ,
ReplyDeleteany change on USD count ?
Hello Joe
ReplyDeleteThank you for your answer.
First I have to state that I think I asked my question wrongly, maybe because I am not American and not English speaking.
Never was I trying to say that “hyperinflation will result in a wave 2”.
What I was trying to say, was: do you see any possibility of a real hyperinflation to start, after this minor 4. (When it turns out to be a minor 4, or when it turns out to be a 2 of a larger 5th wave diagonal, or if it turned out to be something else).
But luckily, you also answered my question in a way for me to “click” something in my head J (So thank you for that!)
Now I will clarify my thinking and after, I leave it with that, because it’s a little off topic from your good analyses.
You stated “DJIA which was a 40 in 1932, and was recently at 22,140!”
You also stated “And a house that used to cost $30,000 now costs $300,000.”
Now, you did not say anything about the year for house prices, so I looked at the house prices from the 1930s
https://babel.hathitrust.org/cgi/pt?id=uc1.b4001050;view=1up;seq=78
We can see that median price would be somewhere in the range of $5000.
So house prices went from $5000 to $300 000 while DJIA went from 40 to 22140 à so as you stated the hyperinflation is seen in the charts first!.
So we basically have seen hyperinflation in financial assets, and normal (or even low, when compared with money (debt) creation) inflation in physical goods.
Now what I really wonder is, imagine Primary III being reached, lets say early 2018 (after miner 4 and miner 5 are formed, or whatever other structure takes shape).
Then we see a nasty Primary 4 being build with debt bubbles deflating.
Could you see a REAL hyperinflation starting in PHYSICAL GOODS while the debt bubble deflates (indexes, bonds, other financial assets), all starting to lose value, and all those homeless dollars start chasing real products in the USA à Hence, the Weimar, Zimbabwe hyperinflation that takes place in the us, with prices of everyday needed stuff, tripling first every month, than every week and soon every day?
You see, President Trump is making a case for the structural trade deficit (40+ years of constant trade deficit) to get solved. And he wants a lower dollar.
But in this process I can see this problem being formed…
The trade deficit is average +/-$500 Billion per year (for the last 8 years or so).
This is a physical imbalance. This means USA buy’s +/-500 Billion of physical goods and services more from the rest of the world, than USA sell’s to them.
To make it count on the balance of payments, USA sell’s debt at the tune of +/-$500 billion a year to foreigners.
The foreigners like this US debt because USA has the dollar and this is the world reserve currency so investors (and for example Central Banks) buy US monetary plane dollar denominated financial assets (debt and other security’s) to hoard the dollars.
This is the cause of the trade deficit!!! That’s important!
When Trump can manage to make foreigners NOT buy US financial assets (capital flow can turn very quick), then the trade deficit will get resolved when the dollar finally dumps.
The trade deficit could get resolved with a lower dollar, but the USA is addicted to the incoming goods. So The USA will still buy as much goods as before, and sent $500 Billion to much to foreigners who will change those dollars for local currency (and sending the dollar down on the FX markets), or foreigners will be outbidding us goods from American people, hereby making prices in US inflate! The combination of those 2 will kick in the hyperinflation in physical goods.
And when you think Americans just have to crush a little of their lifestyle (buy less goods from foreigners), to make the trade deficit disappear, think again…
The biggest buyer of these goods is the us government. So they will not be able to crash the lifestyle and will be printing fresh US dollars to buy up foreign goods, which will be fuel on the fire I guess…
First. You are not following my published wave count. Either Primary IV happened at the Feb, 2016 low, or it happened at the 2009 low. So I think we are - either way - in Primary V, now. That means deflation of debt is likely - to at least 2020; maybe much more. Beyond that will depend on what policies have actually been put into place - not those which are speculated to occur.
Delete