Wednesday, August 21, 2024

All Hail .. 3

Today in the SPY cash index largely went sideways on the smaller timeframe after one pop to a higher high. Below is a chart of the SPY cash 10-min, showing one very valid form of a potential running triangle.

SPY Cash - 10 min - Potential Triangle (alt diagonal)

As you can see the potential e wave retraced over 62%. So, it could be over. But e waves can also do some more time-wasting things. For example, they could form a double-zigzag lower. But they could form an ending triangle within the triangle as well. All of that remains to be seen, yet. Since, the potential triangle could be over, it might pop in the overnight.

There are only three things we can say. First, above b wave and the triangle is likely over with a thrust due next. Or, second, under the a wave, first - without having gone over the d wave first - then possibly there is a diagonal lower starting out with three-wave sequences. As of this time, there is no sign of the latter. Third, price has not yet been driven very far into the apex of the triangle yet so it may have further to go - but that is a judgement call.

So, keep a close eye on things and remember the saying, "trading is treacherous in triangles".

Have an excellent start to the evening,

TraderJoe

Tuesday, August 20, 2024

All Hail .. 2

Today was a Doji, including a higher daily high, and day two of embedding - with a third day where both the %K and %D of the Daily Slow Stochastic (DSS) over 80 is required to fully embed. That means tomorrow is the day most at risk of not embedding - and that certainly does not mean it can't embed.


Make of it what you will. The daily close bias is still up as price closed over the 18-day SMA. The daily swing line is still up. While price resistance might be the upper daily Bollinger Band, initial support might come in around the combination of the 18-day SMA and the 100-day SMA.

The wave count is stretched and strained. Yet, when price started down today, it fizzled pretty darn quickly. Intraday we were trying to count an expanded flat, up, after a diagonal down. And within the potential 'C' wave up the fourth wave just missed overlapping the first by cash close. If it should fail in the overnight, perhaps the Flat up wave counts as w-x-y. Or perhaps a larger diagonal is forming. We'll see.

Might be worth it to assess the overnight price action and see what - if any overlaps develop. Right now, the price movement was very 'grindy' both down & up.

Have an excellent start to the evening,

TraderJoe 

Monday, August 19, 2024

All Hail ..

Machines and Buy-Backs. Information from various sources reports that the low volume, nearly straight-up rise since the outside-day-up on 08 August is largely corporations buying back their stock before the window closes again. And, if you have followed my paraphrase of Ira Epstein's Guidelines for trading you have seen several things play out as noted on the daily ES chart, below.

ES Futures - Daily - Swing Line Up


Items that have played out according to Ira's Guidelines (provided here back in 2015 at this LINK).

  • Jul 15th: Do Not Buy new here against the upper daily Bollinger Band
  • Aug 5th - 8th: Do Not Sell new here against the lower daily Bollinger Band
  • Aug 7th: High of Outside Day Down (ODD) should not be taken out or it's a trap for the bears
  • Aug 8th: High of prior ODD taken out by outside day up; trap for bears sprung
  • Aug 13th: Price closes above 18-day SMA setting the bias and the swing-line UP.
  • Aug 15th: Daily Slow Stochastic (DSS) over-bought only.
  • Aug 19th: Only first day of DSS embedding. Needs two more days.

Note, too, that every single day since the outside-day-up a higher-low day followed. From then 'till now, there was no lower low day to allow less risky entries into the trend. Thus, the machines have done their duty buying back the corporate stock. A question now might be, "what now from here?"

Well, I think the best answer is the one Ira typically provides. That is, "with an over-bought stochastic and price nearing the upper band, I'll just let someone else own it here. After all, price only tends to close outside of the bands only ~5% of the time. That is until or unless it embeds - which it has not done yet."

It is my hope that providing this near real-time summary - with comments made by this blog at the time - can help provide some appreciation for the power of his guidelines.

Now from an Elliott Wave perspective, it matters to the count whether it closes over the top or not. So, we watch closely and see what we can see.

One thing we can see - because we're not blind - is just how close in proximity a new all-time high might come in relative to the timing of a political convention. That's just a coincidence, right? It's not like the President might have called up the PPT (Plunge Protection Team) with a message like, "Hey, Japan's threat to raise interest rates might destabilize our markets. See what you can do about that." Nothing overtly political, right? If you're in a bridge-buying mood, I'm selling - bridges that is. 

Have an excellent start to the evening,
TraderJoe

Sunday, August 18, 2024

What Do You Yen For ?

Over the last couple of weeks, there has been a lot of talk about how the U.S. stock market cratered 'because of' the blow-up of the Yen carry trade - not because of the inherent Elliott Wave count of the U.S. market. Almost all financial news media outlets carried the former story but not the latter (of course). But did / does the Japanese Yen have an Elliott Wave count? We purport to suggest that it does, too, as the monthly chart of the Yen, below shows.

Yen (6J) Futures - Monthly - Zigzag

Note, very simply from its failed ending diagonal high in 2011, the Yen has traced out a simple Elliott Wave 5-3-5 sequence, otherwise shown as Intermediate (A), (B), (C) - a zigzag. And this chart is instructive in a lot of ways. 

OK. Maybe you counted the five waves down to (A) from 2011 to 2015. OK. But then would you have had the extreme patience required to count out a six-year triangle before resuming a (C) wave decline. Really? Six-years?! You would have waited and waited and waited some more before saying, "the next down break must occur."? Um, with my familiarity with readers here, I don't think so. Traders tend to be an impatient lot as it is. And yet, Neely suggests a wave corrective to a motive wave usually takes more time than the motive wave. And here you see a clear example of that in force.

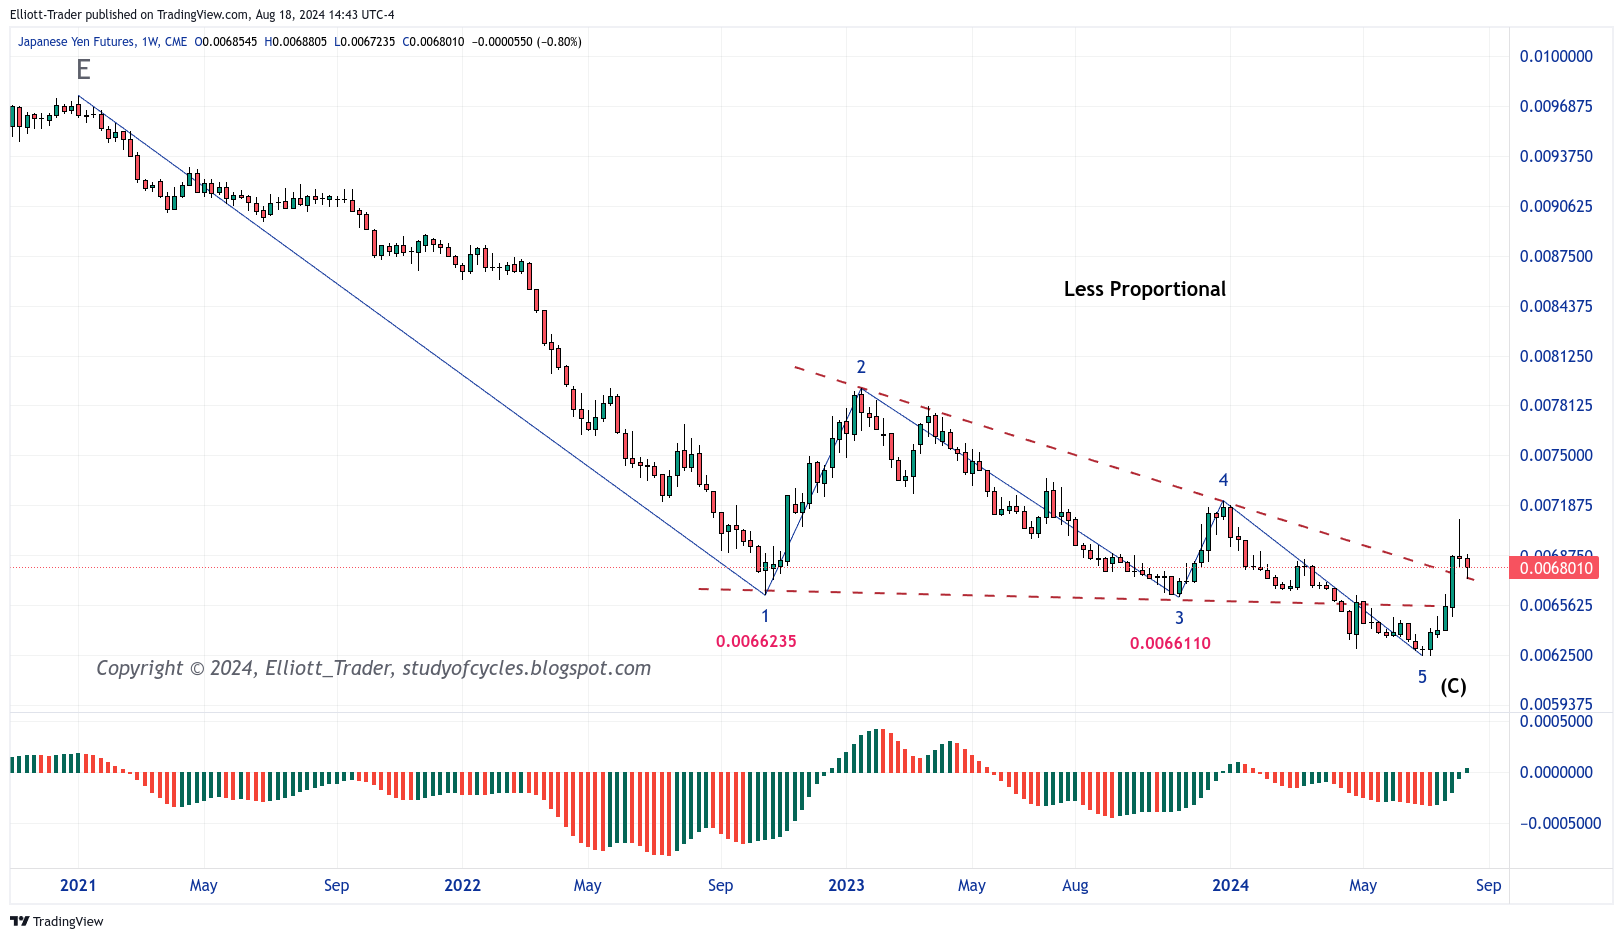
So, what's next? That's all you really care about, right? Well, we are showing the wave as either having finished or having one more much smaller down wave to go. Let's have a look at the weekly chart. Just before we do that notice that the down wave might end at mid-channel of a parallel, above, which is shown, and the EWO is currently green and rising.

Yen (6J) Futures - Weekly - Potential Contracting E-D Ver #1

The above weekly chart shows a less proportional - but still legal - way for the Intermediate (C) way to have ended as an ending diagonal. There is, indeed, a lower low for Minor 3. The issue is that Minor 3 only 'ticks below' the prior low such that 3 seems much shorter than 1.  But the following weekly chart also shows a way the diagonal count can continue for a bit.

Yen (6J) Futures - Weekly - Potential Contracting E-D Ver #2

Above you see the larger diagonal possibility which makes Minor 3 more similar in length to Minor 1. And although the measurement is not included for chart clarity, it shows that wave 4 is 62% of wave 2 which is a very proportional measure in a diagonal. Readers of this blog should independently confirm that measurement. This chart also shows the measurement of 0.0075370 above which the continuing diagonal would invalidate because wave 4 should not become longer than wave 2. Note, too, that the Elliott Wave Oscillator has turned back above the zero line - either the sign of a 4th wave, or the turn, up, for good.

Further it shows that wave 5 of a (C) wave diagonal can fail. This is because the diagonal would be an ending diagonal, and not a leading one.

So now, let's look at the daily chart.


Here we see three likely waves up with c/iii being almost 1.618 times longer than wave a/i. You also see a corrective looking down wave which is at the junction of a rising trend line from 0 - b/ii and from a declining overhead trend line. And you see price turning up from this lower trend line. Further, you will note that price has come down to the 18-day SMA in red, "the line in the sand".

From here, The Principle of Equivalence says we are in the same position as the equity market. If price rises and creates an impulse, we must accept its implications. And, yet, if price falls, we know to where it might fall and what it's limits might be. We also have a pretty clear idea of invalidation levels and overlaps that can be watched, especially above. Right, now a fourth wave is not overlapping.

In any event, the Yen carry trade is for the uber-wealthy that have access to the banking and trading resources to carry it off. It is difficult for smaller players to participate in (except as usual, in trying to ride the coattails of the big players).

Still, a couple of days ago no less than Jamie Daimon expressed a Yen that the wealthy be taxed more, echoing the concerns of Warren Buffett. You can read the story at this LINK. I personally concur for a lot of reasons.

First, is the example above. If the very wealthy can participate in a Yen carry trade like above 'just because of their size' and the smaller investor is at a huge disadvantage, then shouldn't increased taxes on the wealthy's profits be one manner of off-setting that purely positional advantage? Can't we level the playing field a bit? I mean they already have large algorithms, and news-reading computers, etc. How much more of an advantage do they need?

Second, by definition, wealthy people have their lower sections of Maslow's hierarchy (safety, security, food, shelter, etc.) taken care of by virtue of their money. In any society which seeks to progress, shouldn't these individuals be the ones who more help advance everyone's state in the society? No, I'm not saying to any extreme level. Just more so. Or at least proportionately so. We all know there are still corporations that pay zero taxes. That is, they give back nothing to the society they are allowed to operate in - except jobs & products, of course. But then, either all corporations pay no taxes should we allow that in the future, or they do so proportionately, and not just by legal legerdemain.

And what would the society do with such taxes - just hand it over to the poor & needy? Well, maybe some of it - but we know there can be some disincentives to behavior if that is taken too far. No, what about devoting much of it to infrastructure improvement, to improvements all can benefit from? Chief among these must be clean water and clean air to keep health care costs down.

For example, just imagine if a good use of A-I (whenever it fully comes on board) is not just to out-game the enemy in war (real or otherwise). But what if A-I could actually control your traffic lights in real time so that your car used even less gasoline or electricity, than sitting idly by at an intersection with no traffic coming from the cross-directions. This could help reduce the level of pollution and frustration for nearly everyone without implementing what looks like "handouts".

I hope Mr. Daimon and Mr. Buffett can get some further traction on this idea. Because, after all, they are some of wealthiest people, with a Yen to pay more taxes. Enough of the pun - they are literally begging that society increase their taxes. I say we just take them up on it. What say you?

Have an excellent rest of the weekend & start to the week.

TraderJoe


Thursday, August 15, 2024

Good For the Goose & Gander

What applies to the downside, applies to the upside. Right now, we appear to have three-waves up in the SPY cash hourly chart, as below.


The RSI indicator is getting very over-bought. The futures are still up in the evening. The daily closing bias is up. The swing-line is up.

But the Elliott Wave count says we are making either a,b,c or i,ii,iii. It is very difficult to parse which the way things were left. So, The Principle of Equivalence applies again. The actual degree would be at minuet level (a), (b), (c), etc. but I did not put all the brackets in, so the chart is clearer. We'll clean that up on the weekend if needed.

At some point price should try to test the lower smaller channel boundary. From there it will either succeed to hold, or it will fail.

Price is currently above the 62% retrace, and it is nearing the 78% retrace. It is also approaching that prior 01 Aug high bar, which we noted as a daily fractal. There is nothing bearish on the chart yet as the trend has higher highs and higher lows over the 18-day SMA. But the daily slow stochastic is over-bought only (not embedded). And a question one could ask is whether today's cash movement might become part of an island reversal.

The next couple of days should answer quite a few questions. Have an excellent rest of the evening.

TraderJoe

Wednesday, August 14, 2024

Rationale for the Current Count - ES Daily

Below is the ES daily chart with the current Elliott Wave count. This post is an attempt to explain the current chart rationale as completely as I can. First notice, the prior gray up trend line. Absolutely nothing has changed to the left of that line. The upward count is still to wave Intermediate (3) in blue.


Now when you look at the right side of the chart, you see wave minuet (a), down, and you notice it is a larger wave than sub-minuette iv. It should be. The larger degree label means the wave is actually larger than iv on the left. That's what degrees mean. Now notice that minuet (a), down, is also larger than the prior minuet (iv) down on the left. That's ok. If a wave is larger than a prior wave in the same direction than that means the two waves are either of the same degree, or the newer longer wave is of one degree higher. Either can be the case.

Now, look at minute , down. Do you see how this wave is of the same order as the whole of the minute  wave, up? So, the minute  down label is the best we can do at this time. It is not longer than the entire prior up wave, but it is on the same order. 

Because the current down wave is longer in price and time than any of the previous corrections on the way up, I said, "there is likely a turn of degree". And that is what this means. We are likely making a new wave down. 

Confirming this, we broke the up-wave trend line from wave (ii) to (iv) in less time than wave (v) took to form. This is Neely's confirmation Step 1. It passed this confirmation test step. Next, the wave has broken the low of the prior wave (iv) in less time than wave (v) took to form. This is Neely's confirmation Step 2. It passed this confirmation test step. Neely estimates when this happens that the odds increase to 90 - 95% that there is a true trend change. So. The above count goes with those odds.

Now, because of the position of the Elliott Wave Oscillator on the daily chart, it looks like only a first bump down has been made - hence a first wave down. Yes, that is a judgement call from working with the EWO over the years. So, be that as it may. Accept it or not.

The next piece of rationale is that the up wave has just about reached the 62% retrace level. So, this seems like a second wave location - even though that location may turn out to be higher, like 78%. If we are dealing with a diagonal down, here, diagonal retraces can be 62 - 81% per The Elliott Wave Principle by Frost & Prechter. And a down-trend line from the highs is very close by. You should draw that one yourself.

It is true, I simply cannot tell you if the diagonal forms whether it will be a contracting diagonal or an expanding one. How is that for Elliott Wave uncertainty, and Elliott Wave probability?? I can't tell you what I can't tell you, and I won't.

One thing I know I told you was on Tuesday August 13th. Quote.

Today saw more of the same "vol squeeze" referred to yesterday and brought ES daily prices up above both the 100 and 18-day SMAs. Temporarily, this flips the daily bias to up and puts a swing-line uptrend into play with the CPI report due out tomorrow morning. 

So, if you were one of those cowboys who took heavy short positions while price is above the 18-day SMA, then you are at fault. Not me. I told you both that there was a squeeze on, and that the bias was up. If you decided to do something different - that was entirely up to you. 

And during the day today, I said unless the day's low was taken out, they could still squeeze out a triangle (higher) or a diagonal (higher). Well, they did still squeeze it into the close. There may be a triangle there. Or more. It would help all to realize how similar triangles and diagonals can be because of their three-wave sub-components.

So, before I leave off for the night, let it not go unsaid. "Yes, there are only three waves down!" Could the entire correction be over? Well, it could be in the same manner that "anything is possible". But then this down correction would seem extremely short-in-time compared to the entire prior up wave. But it can happen. It's just that the odds are lower.

Have an excellent rest of the evening,

TraderJoe


Tuesday, August 13, 2024

Upward Overlap

Today saw more of the same "vol squeeze" referred to yesterday and brought ES daily prices up above both the 100 and 18-day SMAs. Temporarily, this flips the daily bias to up and puts a swing-line uptrend into play with the CPI report due out tomorrow morning. Further, upward price movement was sufficient to overlap the first downward wave on both the futures and the cash SPY.


ES Futures - 4 Hr Close Only - Overlap


So, The Principle of Equivalence tells us that i, ii, iii = a, b, c until it does not. Today's overlap greatly ups the odds that the (a), (b), (c) shown at the minuet level is the more correct downward count. That would mean that any further downward progress - say to the 200 day-SMA would be by diagonal only, and this count would suggest such a diagonal might be a contracting one - with the low being minute-((i)) (or circle-i or ⓘ). For the expanding diagonal count, one would have to suggest that (b) is a zigzag (ii) and not a Flat wave - which is what it looks and counts like. So, that count has diminished odds at the moment, but it just can't be completely ruled out.

As for the up wave, it is currently in a parallel and showing some increased acceleration near the upper parallel line. But I'd like to reserve the count on that wave until we see the reaction to the CPI report. There are currently a couple of ways to count it, and if it is a zigzag then often times the 'c' wave of the zigzag pierces the upper channel line. Right now, it is in a pretty strict parallel and that would be a bit unusual.

Have an excellent start to the evening,
TraderJoe