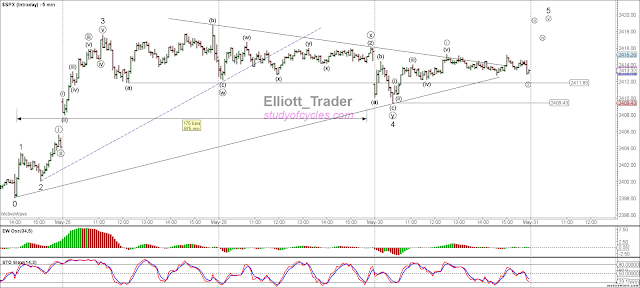
The potential triangle did indeed break down slightly, adding two additional waves that we are showing below, and making the 0.382 x wave 3 mark. The 4th wave now counts as a flat-x-zigzag and that is still an acceptable structure for a fourth wave.
 |
| SP500 Flat-X-Zigzag for wave 4, so far |
You'll notice how much discussion there was about the potential wave 4 non-limiting triangle last week. It was a lot of hot air over nothing. The triangle did not even exist. Only a potential triangle existed. I show you this short term detail again, so you can see that regardless of how much a structure looks like a triangle or a diagonal, and no matter how much it acts like it, it is not a proven triangle until it meets all the requirements in every aspect.
That did not occur. Some people get mad at this. Some people get mad at the analyst for this. I don't. I'm used to it, and it's what I've tried to explain to you is simply The Fourth Wave Conundrum. The fourth wave structure can be very, very, very unpredictable. Get as angry as you like : this is the real reason people distrust Elliott analysts. Not because the analysts are bad, but certain waves are very, very unpredictable by their very nature. You can call it 'excuse making'. I call it 'experience'.
The current count would suggest that trading down into the gap from 25th May would likely start to indicate a larger problem.
Have a good evening.
TraderJoe
No comments:
Post a Comment