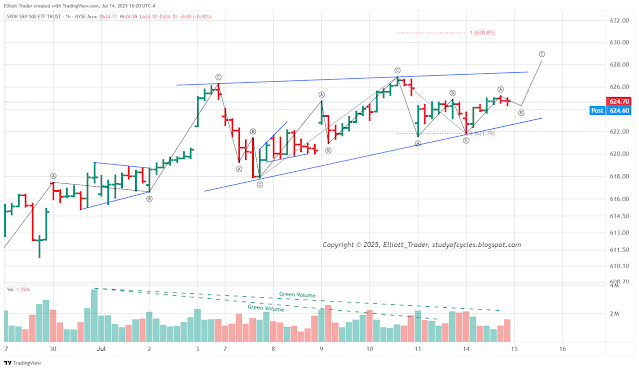
Green volume in the SPY (cash) hourly time frame went to sleep again shortly after the cash open. It didn't stop prices from gnashing higher. The lower hourly trend line held in both the cash and earlier in the ES futures.
If the three-wave sequences we are seeing are part of a diagonal, then the price limit in cash is shown on the chart as 630.85 and in the futures it would be about 6,348. The alternate would be that if the July 3-4 high is actually a third wave, then additional waves would be needed to form a triangle. We'll cover that count more if it begins to materialize.
The market is getting very testy in terms of stalling and prolonging waves. There is a gap overhead and there might be some reason for the market to fill it. We shall see. We are still looking for the Minor wave A, up, to wrap up before beginning a Minor B wave down.
Have an excellent start to the evening,
TraderJoe

At 8.40 for no reason went up by 30 points to form a diagonal
ReplyDeletePretty sure that spike's on news NVDA will resume chip sales in China.
DeleteThanks TJ. It appears ES has completed that diagonal this morning, and SPY on track to at the open. Unless of course we impulse higher.
ReplyDeleteWelcome. TJ.
DeleteSPY/ES (CFD) 1-hr: downward overlap warning just fired. Interestingly, SPY is OK lengthwise, so is CFD, so is ES. But MES went about 1.5 pts too far.
ReplyDeletehttps://www.tradingview.com/x/YXWfh3Im/
TJ
..just fyi - SPY opening cash gap closed. TJ.
DeleteWe haven't looked at RTY in a while - here's a quick sketch at a potential turning point on the daily chart. Chart: https://ibb.co/HpNV3wMq
ReplyDeleteI have a CIT/Pivot 7-23 Target 6450 ES
ReplyDeleteA new post is started for the next day.
ReplyDeleteTJ.