Wednesday, April 30, 2025

How, Not Why

IF you've ever done a crossword puzzle, you know it is veritably the crossword editor's job to use clues as tricky and obscure as possible. When, we look at this ES futures 2-hr chart, we see the potential count of one of the supposedly less probable patterns, the contracting diagonal (alternately a triple-zigzag in a wedge).

ES Futures - 2 Hr - Wedge

Whether it's a diagonal - or its related alternate cousin, the triple zigzag - is of a little less importance at the moment, than 'why' it has formed. It's almost as if the market (or its largest players) is intentionally trying to provide the most obscure counts. And, of critical importance, we don't know that the pattern is completed yet.

I know how it has formed - it is the result of the algorithms attempting 1) to stay over the 18-day SMA, and 2) trying to target the upper daily Bollinger Band. These are goal-seeking algorithms trying to destroy every trade made in the market in an effort to reach their goal, well - except those trades made in accordance with the algo's goal, and sometimes even those.

Again, these patterns are supposed to be among the last to be considered using wave analysis. But here they are.

It is good to have this understanding. Using it, I was able to call out the low probabilities of selling near today's lows. And, when a fourth wave didn't develop downward after almost a 2.618 extension - also called out in real time - then it was possible not to spend a lot of time or effort fighting upward wave counts.

All I can say is that it is a very long wave in time. The amount of retrace of the pattern, if any, is quite uncertain. That is not my fault. If the pattern is the diagonal, it 'could' lead to higher prices. If it's the triple zigzag (for a second or a B wave) it could lead to lower prices. The uncertainty is not mine. I am just counting waves locally according to the rules until the appropriate pattern emerges.

Have an excellent start to your evening,

TraderJoe

Saturday, April 26, 2025

Trickery? Or Not?

We normally do very straightforward wave counts on arithmetic scale in short timeframes (daily, hourly, etc.). And it is in doing this, that we find that the Dow has a longer wave down for (4) than it does for wave (2). But we have always recognized over long time periods - particularly when inflation is raging - the need to keep log charts. Elliott did this, and the purpose is to measure long-term percentage moves on an index. So, when we do this for the Dow, look what we find.


Only if we "log it", use a semi-log scale, do we find that wave (4) both overlaps wave (1) and it is shorter than wave (2) in percentage terms. Is it trickery, or not? Is it trickery that the FED gets to bend the dollar by manipulating interest rates wildly - from 0% to 5% or vice-versa in a veritable heartbeat?

Well, I will only say this pattern won't be thrown-away because of the arithmetic scale argument. We will instead note that inflation was, in fact, raging >6% for much of this time. So perhaps the log scale is the right one for the job, here.

This doesn't necessarily resolve the issue in the S&P500 which has not overlapped yet. And we have one other word of caution. Look at just how many months the Dow took to make wave (3). That means it will be several months likely until we get a final result. This could agree with a triangle in the SPX, too.

This is the second posting since Friday, so have an excellent rest of the weekend,

TraderJoe

Friday, April 25, 2025

Shredder ?

The Eight-Fold-Path-Method, the featured post on this blog (in the upper right-hand corner of the page under Purpose and Ground Rules) has 133 candles on the two-weekly chart of the S&P500.

At the moment, it is awfully close to that fourth wave signature of +10% of the third wave peak on the EWO. The actual value is +78.8, compared to a peak reading of 748.8; awfully close - maybe "good enough for government work" as the saying goes. Maybe not.


What it tells us is we may have entered the fourth wave, and it may not be completed. Note that wave Intermediate (2) is a sharp wave, as A,B,C, down. And non-overlapping wave Intermediate (4) down is an even faster wave down. 

As with all fourth waves, because of The Fourth Wave Conundrum, we can not promise that this fourth wave will hold up. We can only say it has some good probability of doing so. There are two ways that could happen given the shape of the second wave. It could be that a triangle is forming. We have covered this case before. It would be a real shredder on accounts as triangles are very whippy and difficult to trade. But if we only made three-waves down from the wave (3) high, then this is a violent wave which fits the characteristics of the Minor A wave down of a triangle, as in contracting triangles, the A wave is usually the longest in price and most violent or shortest in time.

But we could, with lower probability I think, hobble up over the top in short order and make a flat wave. The problem with that scenario - even though it provides alternation - is that if there is a lower low as the eventual result of a flat or an expanded flat wave, then it would very likely overlap on wave (1).

But, if overlap were to happen, the alternate wave red (4) would have to be considered for the expanding diagonal.

Another advantage of the triangle is that, in the Dow, which has a shorter wave up to Intermediate (3), it has already overlapped downward in a longer wave. That scenario does not meet the rules for any diagonal scenario, contracting or expanding. However, triangles are measured to their wave E's, and this could both eliminate the overlap in the Dow, and the too long measurement of the down wave.

So, we'll take it a step at a time, but the bottoming tails and the ferocious daily gaps are suggestive that we perhaps are in a triangle, and we need to act appropriately. A last advantage of a triangle is that they often give that pesky Elliott Wave Oscillator (EWO or AO) time to come back to the zero line.

Have an excellent start to the evening and the weekend.

TraderJoe

Wednesday, April 23, 2025

SPY Local Count

Here is the SPY 4-Hr chart (yes, with all those gaps) and the current idea for a local count. The A down, B up is for the upward diagonal scenario. This would be followed by a C down to Intermediate (4) of the larger monthly diagonal and overlap of wave (1), up. The 1 down, 2 up is for the Primary  wave at the all-time high.


In this case, the A/1 down is the extended fifth wave scenario, and the minute  wave is the vicious climax low we called out on the NYSE Adv/Dec line in real time.

Please note the alt:  notation should the move fail at this location.

Have an excellent rest of the day,

TraderJoe


Sunday, April 20, 2025

Keeping It Simple in GOLD (GC)

We said we were counting GOLD in parallels until we could no longer. The latest parallel comes from the GOLD (GC futures) 4-Hr chart below. The parallel is shown in blue. As the orange dashed line shows there is no downward overlap as yet.

GOLD (GC Futures) - 4 Hr - Parallel

Still, what can be seen and measured is that the fourth wave (iv) is longer than the largest depth of the prior wave (ii) as the Fibonacci ruler shows. So, the two waves should be of the same degree or else the recent down wave is of one larger degree. For the moment, we'll suggest they are the same degree until / unless there is overlap. 

Next, we see that wave (iv) breaks the Neely-style 0 - (ii) trend line suggesting this down wave is really a fourth wave. The fourth wave still looks corrective, and can be counted as a simple a,b,c (not shown).

So, the chart suggests there will be a fifth wave up. It also suggests that wave (v) will be shorter than the longest wave (iii) that could be drawn because wave (iii) is shorter than wave (i). This suggests a clear invalidation point that readers of this blog should attempt to locate as an exercise. In this case, because of uncertainty in the length of (ii) a small range is acceptable.

A fourth thing to note is the potential truncation at the low on the 8th, and also possibly in wave (ii). Gold has been exceptionally strong, so downward truncations are potentially to be expected, and they should not be counted as additional i-ii's.

So, if a fifth wave (v) forms as a new high, and if it remains shorter than (iii) then one could begin to look for confirmation steps of a turn. The first would be a break of the wave (ii)-to-(iv) trend line in less time than wave (v) took to form. The second step would be trading below wave (iv). And a third step would be trading below wave (ii).

And, if a fifth wave does not form, then perhaps the three waves up are just the B wave part of a larger triangle correction to become more apparent in the future. And if (v) becomes longer than (iii), then likely a diagonal of some sort will need to be considered.

Have an excellent rest of the weekend and holiday if you are celebrating it,

TraderJoe

Thursday, April 17, 2025

Lower Highs, but ...

With today's close in the cash market, the last four bars of the daily ES futures have a pattern of lower highs. But, as yet, there has not been a significant lower low.


So, there can be a number of patterns at play including a couple of triangles. Still, price is currently below the 18-day SMA and so has a negative bias. The daily slow stochastic has worked off an over-sold condition and is neutral at the midline.

A lower low than yesterday would likely have the effect of making a lower high and a lower low below the 18-day SMA, but that hasn't happened yet. So, we just remain flexible and are counting on smaller time frames.

Have an excellent start to the evening,

TraderJoe

Monday, April 14, 2025

What will Yields Yield?

Here's a look at the 10 Yr US Gov't Note Yield on a weekly close basis, the way I have counted since the low, so far.


IF we've completed a triangle, and it looks it, then there could be one good pop up to 5.5 - 6%. The MACD looks very flat and near the zero line. The Minor E wave of the triangle did come back to cross over the Intermediate (3) wave to the left, validating a potential running triangle. The next expectation would be to exceed the high of wave B at minimum.

One might note that considering just the A wave as a (4)th wave location, instead, does not provide good alternation with wave (2). The triangle provides excellent alternation and is much longer in time, as well.

Have an excellent rest of the evening,

TraderJoe

Sunday, April 13, 2025

Unparalleled ?

We said we were counting Gold (GC Futures) upward in parallels until we could no longer. The upward wave measurements recently have locally gotten disproportionate. So, we went back to the wave count to see what other look makes sense. The monthly chart of GOLD is below with the tentative adjustment and a new parallel.

GOLD (GC Futures) - Monthly - New Parallel ?

The suggestion in this count is that the overall diagonal, down, from 2011 was a Primary  wave down, followed by a stubby Primary  wave, and a truncated Primary  wave down to Cycle wave IV. Then, the 2020 up wave is a Primary  wave, and so on, as labeled. This provides the proportion that Primary  is now a little longer than 1.618 x Primary  on linear scale. One will note the EWO is on a maximum. Soon, a Primary th wave could get underway. Note that both the right edge of the lower trend channel has risen above the Primary  location and so has the monthly EMA-34.

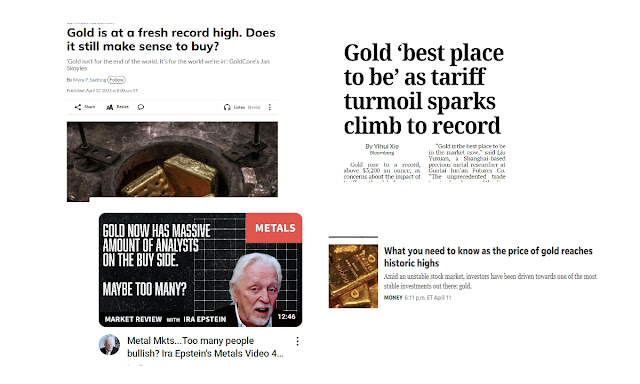
Having said that, please note that GOLD is starting to make the news regularly, as below.


And, as Ira indicates, there are many, many "buy side" analysts recommending GOLD, so this could be a sign sentiment is heating up and a correction is due.

Nothing on the charts says GOLD is a sell yet. We don't know that Primary is over. But GOLD is up to the upper daily Bollinger Band in an over-bought condition and not embedded. So, it bears watching yet. And any fourth wave could be very grindy, meaning that it could be difficult to trade.

Still, no other proportion seems reasonable at this time on the longer-term time scale. Price has surpassed most other measurements of comparison with smaller degree labels.

Have an excellent rest of the weekend.

TraderJoe

Friday, April 11, 2025

Still Some Odds

Tonight, I wanted to briefly cover another alternative I thought of which says that the decline is not quite over, yet. Previously, I have showed you ways I think the market could go higher (see post at this LINK). Here is one where I show you a way that the market could go lower. The is on the ES 8-hr chart and it is response to the question, "What if the market is in a smaller, not a larger, triangle?"


If I reconfigure the decline as five minute-degree waves, with an extended fifth wave shown as x, then that could be the Minor A wave, down. The smaller triangle could be a Minor B wave up. And this could be followed by a Minor C wave down to overlap the 2022 high - which hasn't happened yet.

So far, we have one zigzag up - shown as (a), (b), (c) to  of B. So, a lot more market churn could happen in the news if this scenario were to play out before the Minor C wave down got underway.

To be fair, the B wave could also be "any three", such as a double-zigzag so it could play out that the level of B is higher - more near the prior minute fourth wave - which is often a target for B waves.

And then, under this scenario the C wave could be either an impulse or a tough-on-the-nerves diagonal.

All, this is just an option at this time. IF we trade above  of the triangle, and significantly above the minute fourth wave, circle-iv, then the option simply becomes lower odds.

The problem at the moment is we are in no-one's land, and we still need to count locally until the larger structure becomes more clear.

Have an excellent rest of the evening and the weekend,

TraderJoe

Wednesday, April 9, 2025

Whip on Wednesday

Yesterday, we clearly warned that price was four consecutive days closing below the lower daily Bollinger Band. We even clearly titled the post, "Day Four". Today, in a whippy day, we probably closed inside the band (as this is written, there is about 20-minutes of futures trading yet). Here is the ES daily chart as of this time.


After the daily slow stochastic was over-sold, only, and not embedded, price made an outside reversal bar up. And there would not be much to speak about immediately to the downside unless the low of today's bar is taken out lower in the next two trading sessions.

A day like today is what was anticipated IF the longer-range triangle scenario, posted on March 29th were to come to pass (see LINK here).

So, it is pretty clear we have only three-waves down off the high. The speed of the move and depth of the move indicates it could still be the Minor A wave - but of a triangle OR, it is just three-waves down of a downward diagonal.

So let me be clear about these two scenarios:
  1. The only way down from here is by diagonal.
  2. The ways UP could be by impulse, diagonal or triangle.
So, it's a mess-and-a-half but as an Elliott analyst one has to keep the larger potential patterns in mind while one is counting locally.

The problem at present is that the market is almost wholly captive to the news. That often results in triangle patterns and decreased trading volumes. But being captive to the news is exactly the way the Smart Money wants it. That is because they own the news-reading algorithms that can take instantaneous advantage of the news. How easy is to write a computer program that says, essentially, if you see the words "Tariff postponed", "Tariff delayed", "China Tariff reduced", etc. in a news story, then BUY.

And because the Smart Money is involved, it would not surprise me at all if the news stories were being coordinated so that the appropriate people who are responsible for making these stories get their commensurate kickbacks. This is America, after all, home to some of the greatest corruption on the planet. And in every situation where large sums are involved, there almost inevitably follow the news stories of who was on the take. We shall see if history rhymes again.

Have an excellent start to the evening,
TraderJoe


Tuesday, April 8, 2025

Day Four

On the ES daily chart, today is the fourth consecutive close below the lower daily Bollinger Band, as shown. This drops the odds to about 2 - 4% of another close below the band. This does not mean that another close below the band is impossible. It just means the odds are dropping considerably.


The regular calculation of the daily slow stochastic is not embedded. It is over-sold. But both the %K and the %D lines are below the 20 level for the second day. So, the third day needs to be watched to see if the embedded status is obtained.

Intraday we made a new high over yesterday in a false breakout. Then we spent about 6 hours in a down trend that we can count as five-waves. So, we may need to spend several hours retracing that move if it is over.

From April 6th, because we can overall count an a,b,c up, we also need to monitor to see that this whippy behavior is not some form of triangle. For example, today it is curious that the down move was a 78.6% retrace on the up move.  By itself, that may be of little significance and a Flat could form in the upward direction as part of a second wave ii of wave (v), or simple lower lows could form. But because this is overall a fourth wave, it needs to be monitored for triangle formations as well, and to observe if they invalidate or not. It may be way too early in the wave structure for triangles, so just observe to find the best count that follows the rules.

Have an excellent start to the evening,

TraderJoe

Monday, April 7, 2025

Another Bump

When we left off counting on Friday, we were looking for a fourth wave. The ES 8-hr chart below seems to indicate one was made. This chart presently has about 90 candles on it, so it can develop more in time.

ES Futures - 8 Hr - Minuette (iv) ?

Price is still in the parallel. The chart suggests that a further wave minuette (v) of the minute third wave should be made, followed by a larger fourth wave, minute four (circle-iv). Then, for an impulse there should be a minute fifth wave down (circle-v).

The EWO is still on a low, so we'll begin to look for divergences soon.

Have a good start to the evening,

TraderJoe

Friday, April 4, 2025

Brutal Counting

Today we counted down a likely third wave with two, not one, expanding diagonals at different degrees of trend. The wave counting is brutal. The intraday trading subsequently difficult. There can be no question that our diagonal target was met. And it raises the point that this monthly count may still be on the table for the S&P and the NDX. The ES futures are shown here to be representative.


We have shown the skeletons of this count many times. It is the diagonal count to a Primary th wave that would end Cycle V. Now, finally, on the downside, there is something to work with. Wave (3) is just barely longer than wave (1) in price, and it is clearly longer in time.

We made a notation on the chart regarding possible potential alternation in wave (4). Interested readers should view it. Please keep in mind that I have sketched out an idealized wave (4). Like all fourth waves they can get much crazier than this. Sometimes in a diagonal, wave A comes very down near the trend line before the bounce. Sometimes there is a triangle in the middle of the fourth wave to slow things down and cause traders to lose money fast. Sometimes the Minor B wave bounce is 90% or very nearly there to confuse people with a flat.

But first things first. Overlap on 4,808.25 would first be expected. Then, after overlap, wave (4) must hold above wave (2) to avoid invalidation. Often the fourth wave takes more time than the second wave. So, that's the way we've shown it. And it often retraces 62 - 82% of wave (3) in price. So, the Fibonacci ruler is shown as a guide.

Careful readers might note that the Minor A wave of Intermediate (3) is shown as an expanding diagonal itself. This is what is known as a fractal of the larger pattern if it should play out as shown. It is the only way I can count the wave to observe degree labeling requirements.

Keep in mind this is a monthly bar chart. So, this pattern can take a very long time to come to fruition. To novice technicians it might look like it is forming a large head & shoulders pattern which then fails to play out. 

And if it does invalidate? Place a Primary  and Cycle V at the high of 2022, a Primary at the bottom of October 2022, and a Primary at the high in 2025, and Primary and cycle a at the low near 2,000 (price) to match the low of Primary . We just think the market should have the option of ending a very long wave with a diagonal, and the above count is it, for now.

Have an excellent start to the weekend.

TraderJoe

Thursday, April 3, 2025

Lower High, Lower Low

The swing-line indicator now has a lower high and a lower low underneath the 18-day SMA on the daily chart of ES futures shown below.

ES Futures - Daily - Lower High, Lower Low


Daily price is now down past the lower daily Bollinger Band, with a close below it, dropping the odds to 6 - 7% of a further lower close below the band (not impossible, just lower odds). But the daily slow stochastic is not yet even in over-sold territory. So, the trend is down until it isn't.

Further, I have sketched in the wave ii to wave iv trend line with a parallel copy placed on wave iii. This is Elliott's second parallel technique and is often the first target for a fifth wave, v. The next targets, if the first is exceeded, would be 0.618 x net [ iiii ], or v = iii. So, there could be more downside. Just be cognizant the Payroll Employment report is coming up tomorrow, and it could wreak havoc with volatility.

We will note that 'many' chartists will not be very persuaded there is an uptrend coming until or unless there is an outside bar up, tomorrow, with the close respectably in the upper third of the candle. Then, the low of that bar would have to hold for two days, and price would have to make a close over the 18-day SMA again.

So, be careful. One initial target is dead ahead. Have an excellent start to the evening,

TraderJoe

Wednesday, April 2, 2025

Rules Not Broken

Nothing about this count breaks the 'rules' of Elliott Wave. The overnight wave is the very definition of impulsivity.


Wave iv may be a failed 'double-combination' wave. It is 13 bars long compared to wave iii's 8 bars. So, it is longer in time, as Neely likes to see. Also wave iv breaks the Neely 0 - ii trend line.

Price is down at the lower daily Bollinger Band. Can it go lower? It can. We'll be on the watch.

Have a good start to the evening,

TraderJoe