Thursday, July 31, 2025

Outside Key-Reversal Day Down

From the highest high in the trend count, probably the high of the Minor A wave, up, today made an outside key reversal day down, as shown in the ES daily chart, below at the cash close.


Although Amazon and Apple earnings are not out yet, this is also accompanied by the loss of the embedded status of the slow stochastic and a close approach to the 18-day SMA at this time. The only day the embedded status can be regained is the next day (tomorrow's close).

The high of an outside day down should not be taken out within the following two trading days or it can constitute a trap for the bears. With this in mind, it bears watching the impact AMZN and/or APPL may have on the count. Further, the tomorrow is the first of the new month with possible inflows from the usual passive sources, so some sort of correction may result.

If price starts significantly trading down through the 18-day SMA, and closing there, then the Minor B wave is more likely underway.

Have an excellent rest of the evening,

TraderJoe

Wednesday, July 30, 2025

Copper Tariffs and Earnings

One more trip over the high is possible yet not required. The black and the red count below are equivalent until they are not by The Principle of Equivalence. This is the SPY 4-hr CFD. Prices today were whipped about by the FOMC results, the imposition of 50% tariffs on copper, and by mega earnings after the close.


It is possible that Minor B started today, but we must watch into tomorrow as the institutions might want to bite on the mega earnings news. The red count allows another trip over the high. But the wave counting remains ugly with few good true impulse waves. So, we will learn what we can from wave invalidations or resistance points.

Have an excellent start to the evening,

TraderJoe


Monday, July 28, 2025

Three

After three daily closes above the upper daily Bollinger Band, price today made a higher high, a higher low and a lower close. The three closes higher than the upper band dropped the odds to about 3 - 5% of today's close being outside the upper band, and it was not. (While the futures are still trading as this is being written, we think it likely represents the 4 PM EDT settlement time of the futures.)


Note that the daily swing-line indicator is still up with higher highs and a higher low over the 18-day SMA. The daily slow stochastic is still embedded. And until the red line of the slow stochastic closes under the 79 level it is possible there are some pros (or Smart Money machines) that might still try for a higher high against the upper band again.

From an EW perspective today we counted a possible non-overlapping fourth wave down, (iv), as an Expanded Flat. So, a fifth wave up, (v) is possible tomorrow. But, being Tuesday it could also be a turn day, as well.

It is likely that the prior swing-line low of 6318.75 would be of interest as it might indicate the end of an uptrend, and, if broken, would likely be below the 18-day SMA.

Have an excellent rest of the evening,

TraderJoe

Saturday, July 26, 2025

Waiting Patiently

We promised in our last video that if additional waves higher were made this week, it would require a reconfiguration of the Minor A wave higher. Here is that reconfiguration, Essentially, we dropped the degree of the contracting leading diagonal one degree to minuet degree, symbol (i), composed of the five sub-minuette degree waves, symbols i-to-v. Then minute  is composed of the five minuet degree waves symbols (i)-to-(v). This count has the additional benefit that minuet (b) is shorter in price and time than minute , the previous higher degree wave in the same direction, preserving degree labeling definitions.

ES Futures - Daily - Minor A Reconfiguration

In this configuration, Minute wave and Minor A now has a new limit shown on the chart of 6,633 because again the third wave in the futures is shorter than the first wave. 

Critical note: since minute  is now an impulse, and the leading diagonal is only a minuet degree sub-wave, it is possible for this minute  wave to be an ending diagonal because it is at a different degree. So, it can either be an impulse or an ending diagonal wave. So, first we will show the current SPY 1 Hr chart in the impulse configuration as another extended first wave, at minuet degree, 

SPY Cash - Hourly - Minute  Impulse Configuration

We are showing this configuration as the extended wave (i), symbol x(i), because minuet (ii) is only a 38% retrace on the first up wave as shown by the Fibonacci ruler on the right. As you know by now, this is highly characteristic of extended first waves. We note that for the SPY, the lower wedge trend line has not even been broken yet!

As an alternate, we can drop the degree one level for the diagonal configuration as below.

SPY Cash - Hourly - Minute  Alternate Diagonal Configuration

If a diagonal does form, then we would expect a 50 - 78% retracement of the entire up wave for minuet (ii). In that case, the attack on the lower trend line would fail rather dramatically. Although the preferred case is the impulse, because it is simpler, the diagonal alternate is noted for completeness and as another way to extend the Minor A wave in time as the diagonal would have to extend and further cycle through waves (i)-to-(v) yet again.

Have an excellent rest of the weekend,

TraderJoe

Thursday, July 24, 2025

Suggestions

Today, on the SPY hourly timeframe we were watching the Fibonacci 162% external retracement on the three-wave down wave that occurred on 16 July. It's the upper red line on the chart shown. Prices over-ran it slightly but nothing to be very concerned about yet. The SPY Cash 1-Hr chart is below.

SPY Cash - 1 Hr - Some Suggestions

There were two possible indications of a top: First, the potential extended fifth wave of c/iii with this wave shorter than a/i. Second, there appeared to be a diagonal forming that we counted in real time. So, the current up count, if it holds could be a,b,c to a (b)-3 wave. Such a (b)-3 wave could be for an expanded Flat or a triangle.

But we don't know upward movement is over. There are still no downward overlaps, nor the undercutting of any significant lows, yet.

So, watching the trend line sketched in, if prices respect it and make a higher high, we will probably conclude there are five-waves-up at that point, and configure the count with Minor A at the new high.

If, on-the-other hand prices breakdown significantly, and perhaps back-test the trend line and fail, then we could likely be in either an expanded flat or triangle scenario. These are very testy waves at this point, and we must just count what we see going forward. At least we have some ideas of the like possibilities.

Have an excellent start to the evening,

TraderJoe

Wednesday, July 23, 2025

IF Today's High Holds

In the SPY cash index, IF today's high holds I am only pointing out that there would then be a 138.2% Fibonacci relationship with the prior three down waves. I am doing my best to count by legitimate 'fives' and you can see where I've done that explicitly on the chart.


But whether because of overlap or because the time relationships would otherwise seem too bizarre, there is a point where they don't work well. So, this structure could be (a)-3, down, and (b)-3, up. Today's tiny higher high in cash, still not over that 633.94 level, is on a whopping MACD divergence.

There are diagonals galore in these counts. You can see two of them in the space of a week in the above chart. But, if you want to see the count proceed by fives to the extent possible, then as far as I can tell, that is what's involved.

The above count does - if it holds - mean that the Minor A wave may have finished on 15 July, and we could be into the Minor B wave now.

Have an excellent rest of the day,

TraderJoe

Sunday, July 20, 2025

Video Update - July 20, 2025

Here is a brief Elliott Wave weekend update video which is designed to take less than ten minutes of your time, compared to some updates that can take an hour or more. As always, hit the full-screen icon on the video player to see the detail in the charts.


I hope you enjoy the content and look forward to seeing what the next week in the markets brings.

Have an excellent rest of the weekend and beginning of a new week.
TraderJoe


Wednesday, July 16, 2025

Snoozy Clue (3)

The chart news today is interesting on the ES daily chart, below. First of all, as shown by the Fibonacci ruler on the right, we have a longer wave down than the 7 JUL down wave. This 'should' mean - by the rules - that we are out of what appeared to be a diagonal formation at the high.


Second, while the lower today today moves the swing-line indicator temporarily lower, price is still above the 18-day SMA, although it did come quite close to tagging it before rebounding, Meanwhile the daily slow stochastic (regular calculation) continues to have lost its embedded status.

From a news perspective, it was filled with money-laundering bank fines, tariff news, and quasi-news about firing the Fed chair, all of which made for a whippy market.

From an EW perspective, all we have in the ES is one price segment down (like a small i or a), and then a large Flat wave following it that did make greater than a 50% retracement on the down wave. We'll see if this is enough to get prices moving such that they close below the 18-day SMA or not. It remains to be seen.

Have an excellent rest of the evening,

TraderJoe

Tuesday, July 15, 2025

Snoozy Clue (2)

Today's ES price movement was higher, then lower. But, it was not a full-on outside reversal day let alone a key reversal day. Still prices did have the odd structure of a higher high and lower close. What might turn out to be a bit more significant is that in tonight's overnight action the series is possibly on the verge of losing its embedded slow stochastic status. If, the red line of the slow stochastic closes below 79 by the close tomorrow it might set a different tone on the daily chart, below.

ES Futures - Daily - HH/LC Day

If the embedded reading stays lost, then price and the 18-day SMA might try to come together again. Still, such price movement would not set a trend lower yet. Lower lows and lower highs below the 18-day SMA are needed for that. If that should occur - and we don't know that it will, then the lower daily Bollinger Band would be the first target after the 18-day SMA. Let's see how it goes.

Have an excellent rest of the evening,

TraderJoe

Monday, July 14, 2025

Snoozy Clue

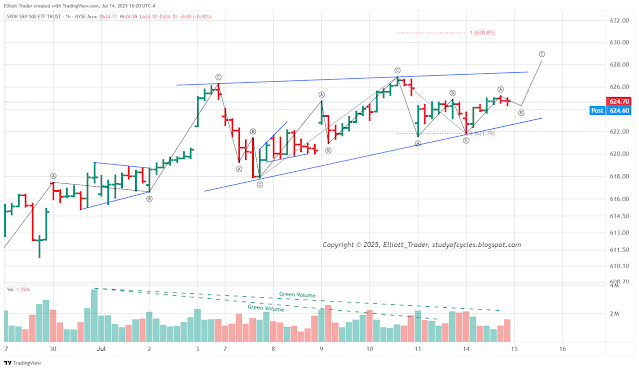
Green volume in the SPY (cash) hourly time frame went to sleep again shortly after the cash open. It didn't stop prices from gnashing higher. The lower hourly trend line held in both the cash and earlier in the ES futures.


If the three-wave sequences we are seeing are part of a diagonal, then the price limit in cash is shown on the chart as 630.85 and in the futures it would be about 6,348. The alternate would be that if the July 3-4 high is actually a third wave, then additional waves would be needed to form a triangle. We'll cover that count more if it begins to materialize.

The market is getting very testy in terms of stalling and prolonging waves. There is a gap overhead and there might be some reason for the market to fill it. We shall see. We are still looking for the Minor wave A, up, to wrap up before beginning a Minor B wave down.

Have an excellent start to the evening,

TraderJoe

Saturday, July 12, 2025

Dow Follow-Up (2)

In a further follow-up to the May 18th post (see post at this LINK), now some two months later, the market continues to take its time to complete this pattern. Now at 139 two-weekly bars, the Elliott Wave Oscillator's (EWO or AO) fourth wave signature, dipping below the the zero line - which is not always required, but did happen this time - is apparent. So too, can be seen the initialization of the fifth wave up bars in the oscillator. The EMA-34 can be seen to be winding through each numbered wave for good form and balance.

DOW (YM) Futures - 2 Weekly - Likely Diagonal


The pattern could take a while yet, especially if the next Minor B wave becomes a triangle. The pattern is trying to put you to sleep and make it difficult to trade at the same time. And, it may be waiting for some news to make you think there is a reason for the decline - whenever it comes. And, yes, the Minor A wave can go a bit higher if it wants.

Is it possible for a pattern like this to fail? It definitely is. But, as of yet, there is not real good evidence of such. And based on the lengths of the prior waves, we are trying diligently not to rush the count and would like to see if the full A,B,C zigzag develops.

Have an excellent rest of the weekend.

TraderJoe

Thursday, July 10, 2025

It's Summer 🔥- 5

Between yesterday and today, Jul 9th and 10th, we could count five-waves-up in an impulse to the local higher high today as shown as the right-most c wave on the SPY one-hour chart, below.


Green volume appears to be declining as bulls lose some interest at the highs. Red volume is picking up but nothing to write home about yet. The volume profile on the left of the chart shows the point of control (orange line) for this particular up wave being located within the gap in the triangle. This is a level to keep an eye on.

From the left the first a wave up is an impulse, then a b wave triangle followed by a thrust from the triangle for the first c wave. The next a wave up is an expanding diagonal, followed by a brief and sharp b wave down. The diagonal is then followed by the impulse up of the last two days for the c wave and good alternation in a corrective wave.

I haven't done much intraday posting as few seem interested. Have an excellent start to the evening,

TraderJoe

Monday, July 7, 2025

It's Summer 🔥- 4

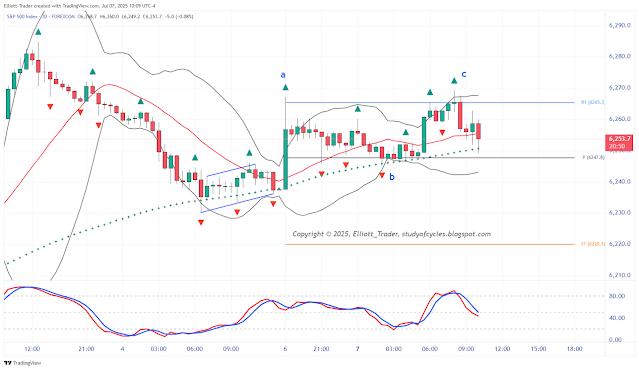
So far, the overnight action has an a-b-c, up, as in the ES/SPY (CFD) 30-min chart below. The intraday slow stochastic is meandering around the 50% level.

ES/SPY (CFD) - 30 min - a,b,c up


The a wave up is an expanding leading diagonal, and the c wave is an impulse for good alternation in a corrective wave that has a marginal higher high. Three waves unfortunately does not provide that much information yet except that it looks corrective at this point.

Please be sure to translate this to the instruments you are following. Have an excellent rest of the day and start to the week.

TraderJoe

Wednesday, July 2, 2025

It's Summer 🔥- 3

Nothing wrong with the current count. Today in the ES/SPY was a halting, grinding, slow day upward to the new high. There could easily be more, within limits. Here is the current count, simply continued from the previous chart on the SPY 15-minute timeframe. We'll be switching to the SPY 30-minute shortly.

SPY Cash - 15 min - Count

There is no clear indication that wave (iii), up, is over, yet. It does not have to be. For a contracting diagonal it must remain shorter than wave (i). So far, it has been. If a fourth wave (iv) occurs it should remain shorter than wave (ii), to continue a contracting diagonal.

Retraces can definitely occur, but not below the low of wave (ii) without repercussions for the count as is shown on the chart.

Have an excellent start of the evening, and an excellent rest of the possible vacation week if you are taking it off.

TraderJoe