Saturday, May 31, 2025

Critical Level

Since Thursday's high in the ES futures, there is about a 65:35% chance that the down movement is only a "three", or an a,b,c lower on the ES 30-min chart, as below.


The length of the b wave being much longer-in-time than entire length of the a wave down seems to mean the two legs should be of the same degree, rather than be an internal fourth wave. Certainly, we counted the c wave down as five-waves-down that started with an expanding diagonal on Friday.

Further, on Friday, we popped the parallel to the upside in what we counted as five-waves-up followed by a flat wave.

That would seem to make Thursday's cash high a critical marker for the future. If the high of the futures equivalent, the bar that opened at 09:30 ET on Thursday, at 5,956.25 is exceeded higher, it would tend to invalidate any such 1-2 down in the cash market. So, we think if that occurs, some kind of flat or expanded flat might be forming for the Minor B wave lower.

If that level is not exceeded, then it is possible we are going lower by diagonal or multiple zigzags, so this is where patience is really necessary, and we will have to watch and count locally as best we can.

The daily chart, too, looks like yin-yang candles, and this not a very impulsive start if this is the Minor B wave. However, while price is still above the 18-day SMA, the daily slow stochastic is still in over-bought territory and the suggestion is new money would not immediately begin chasing the move.

Over the weekend there was news of possibly taking steel tariffs up to 50%, for which the EU said it might retaliate if that occurs. Monday June 2 is the first trading day of the new month and the inflows from passive investment sources may occur. We shall see.

For now, have an excellent rest of the weekend,

TraderJoe

Thursday, May 29, 2025

Shock and Awww!

Readers of this blog know we were looking for a way to complete five-waves-up to a Minor A wave on the ES 4-Hr chart. With last night's shocking higher high on Nvidia's earnings and on word of tariffs being partially blocked, we got the needed higher high. By mid-morning though all of those gains were given up in the futures and then some - creating an outside range day down, as below on the ES daily chart. Aw.


The non-overlapping count is one of the few ways I can find both to follow degree labeling definitions along with the other rules of wave counting.

Note that the daily slow stochastic is not embedded, and it is possible the Minor B wave, if underway, will try to attack the combination of the 18-day and 100-day SMA's and possibly the lower daily Bollinger Band as an initial target.

The other news is that if you thought counting the Minor A wave, up, was beyond nuts, then counting the Minor B wave could be equally or more difficult, as it can be "any three" including a contracting triangle, single, double or triple zigzag, a Flat (including running flat, or expanded flat), and it could turn out to be a dreaded expanding triangle, too. Further, various legs could be composed of contracting or expanding diagonals that will be difficult to read.

We'll do our best, but as you can see last night, the news can change things in-a-hurry so be cautious and prudent whether big news is scheduled - like the employment report - or it is a story that surprises.

Have an excellent start to the evening,

TraderJoe

Wednesday, May 28, 2025

Inn & Out

Nvidia earnings are now "in" the market, and the ES 1 hr futures are "out." Throw the baby out with the bathwater. They are a mess - dreadful and with overlap. And we just wanted to count "five-up". So, here's the deal: we showed you the potential count several times on the SPY cash 10-min in the comments for the prior post. Here is that one-hour futures chart with all its issues.


We can clearly count three waves up, with a running flat second wave, as either i, ii, iii or the alternate of red a, b, c as shown below price and above the MACD. The dashed 0 - ii trend line is shown, and it was broken today. So, we are likely in wave iv but with a slight intraday overlap. One way around the overlap is if price makes a triangle and the  wave does not overlap. Barring that, we could either make a contracting diagonal with the up waves as red (i), (ii) as shown, or if that does not occur, perhaps we make a fifth wave and have to accept the slight overlap. So, we have to see how that turns out.

Note there is some prospect for sloppy weekend trade as some people are still on vacation. Friday could be a window-dressing day as the last day of the month. And then, Monday June 2 might see the typical 'first-of-month' inflows perhaps with a pop out of the triangle.

Time will tell. The MACD is currently hugging the hourly zero line and looks to be in a fourth wave position, or position for a whippy triangle around zero, but that is only one input to the chart. Touching the lower parallel was another, and it will be interesting to see if we get the repeated trend line breaks that triangles often bring.

Could the analysis be off? It could. If things really break down below today's low, then one might look for a much deeper wave (ii) of the contracting diagonal.

In any event, wave iii / c up is shorter than wave i / a, up and that tells quite a bit. Wave v should be shorter than iii if it occurs that way.

Have an excellent start to the evening,

TraderJoe

Monday, May 26, 2025

To B or Not to Be

Readers of this blog know from earlier posts that we are trying to resolve two different levels of upwards channels. By resolve I mean either make a new high for the channel move or breakdown below the lower channel boundary, back-test that line, and/or fail. The prior hourly channel has been broken downward, with a five-wave move below that channel line - which is essentially the mid-line of the larger channel, shown. Now, as can be seen from the ES 4-Hr chart, below, this larger channel still needs resolution in order to conclude that a Minor B wave, lower, is actually underway.


As many readers know, and have experienced by now, a five-wave move down can - many, many, times - be only the 'c' wave of a larger fourth wave flat.

So, in the ES chart above, we must play the game, at least for a while, of waiting to see whether price goes over the prior high again, or not. Certainly, the MACD could be interpreted this way on this time scale. So, we must diligently watch local price action and try to sort out the impulses from the corrections. If price fails to go over the high again, it could mean a couple of things - one more dire than the other but we'll cover that in subsequent posts. For now, the news bots have the advantage as they look to create a gap up open for Tuesday. And we'll be interested to see whether this persists.

Have an excellent rest of the weekend, and a loud shout-out of 'thanks' to any veterans out there for helping or having helped to keep us secure.

TraderJoe

Friday, May 23, 2025

Apple Scruffs

With apologies to the Harrison title, the President is calling a U.S. company a rotten Apple and imposing tariffs on its products. The result to the ES 1-Hr futures looks to have made a fifth wave down this morning, adding considerable price length to the drop.


And the patience paid off. We'll look at the larger picture on the weekend.

TJ

Monday, May 19, 2025

Debt Forgiven ?

The Moody's downgrade created some overnight volatility, which was reversed or erased by a slightly higher close today. Was the debt erased? Heck no. This is just part of the market's ongoing efforts to convince neophytes that "nothing matters". Eventually, that won't be true. For our part today's minor higher high in the ES 4-hr chart looks to have done nothing but created an extension in the fourth sub-minuette wave, iv, with better alternation in the chart below - and with today as part or most of v.


The minor new high created a larger divergence with the MACD, as is shown by the brown dotted line. But we maintain this larger channel has not been filled out to the downside. And this may yet happen with the MACD heading back towards the zero line. So, we'll see after a volatile up Monday whether there will be a turn on Tuesday.

Have an excellent start to the evening,

TraderJoe


Sunday, May 18, 2025

Dow - Follow Up

The two-weekly chart of the Dow futures, below, has just a few things new on it, on the continued count of a contracting diagonal at log scale shown in several prior posts. First, it is the clear fact that Elliott Wave Oscillator (EWO or AO) with 135 candles on the chart, dipped below zero for the overlapping fourth wave, Intermediate (4).


Second is the fact that there appears to be a Minor A wave up, now clearly on the chart - with the clear alternate noted in red below the price. One might be curious how this Minor A wave up could possibly be counted. Probably my count is not like yours, but it is below.


Even though the Minor A wave structure looks simple enough on the 2-weekly time scale (first chart), to count any five-wave up wave it simply must be counted as an expanding diagonal per the second chart. That is because without the diagonal one runs into degree-definition violations at every turn. But with the diagonal, all three up swings can be of the same degree. And, still, this pattern is supposed to be among the rarest patterns, but here it is in front of your eyes.

Again, the clear alternate for this wave has to be Minor B of (4) with C down to follow, and the second chart would be counted as ⓦ-ⓧ-ⓨ as a B wave in that case. The alternate just means the EWO and price can go a little lower in (4) before the fifth wave begins. That is certainly permitted by the method, and it might allow overlap in the S&P500 so we need to be watchful for it.

In either case, we are expecting downward movement which may have started on Friday. Again, there is no amount of downward movement that will surprise me.

Have an excellent rest of the weekend.

TraderJoe

Friday, May 16, 2025

Trying to Resolve - 2

After the cash close Moody's downgraded U.S. debt (story at LINK here) one notch. If news matters, let's see the reaction Monday. The market for its part made a higher daily high into the cash close. It is still above the 18-day SMA and the slow stochastic is still embedded. In the comments we said that the inner of the two channels in the ES 4-hr chart below has been resolved with higher highs (like a fifth wave of some degree).


The last four-hour candle today was a red spinning top (abbreviated S.T. on the chart) and is hanging right on the lower parallel of the inner channel. Red spinning tops are slightly weaker than green spinning tops. And we have often noted such single-candle patterns required confirmation with a significant lower closing candle. That confirmation is not on the board yet and is not on the board until it is on the board. Still, we have noted two significant levels of overlap should they occur. Further if the channel doesn't hold (lower channel line breaks impulsively lower, is back-tested, and the back-test fails) then it would likely be of longer-term importance.

At the moment we also will note that today's higher high occurred on a lower MACD - so a divergence - and that, too, is just a warning sign until it isn't.

As a reminder of the intraday wave-counting screen, the ES 30-min chart is below. One will note that prices were generally rising until about 8 AM, but they simply could not tag the upper band. That is generally a sign of weakness. Then, prices fell off in an expanding diagonal that we showed in real-time and which concluded around 10:30 am. Like all diagonals, it is very difficult to tell if they are ending diagonals (more common) or leading diagonals (less common). So, all we could say was, "watch the high".


Price did reverse, piercing the intraday 18-per SMA, in according with the daily bias still being up, and an apparent fifth wave was made. So, the diagonal was likely the "c" wave of an overnight Flat wave and likely a fourth wave flat. On the Moody's downgrade the downward movement made a longer wave in price than the prior down wave (as shown by the Fibonacci ruler), and this likely suggests that a continuing contracting diagonal is not being formed from these waves. Price then closed below the intraday 18-period, and the intraday slow stochastic closed below the 79 level. And while a warning, it now again fights with the bias of the daily chart until it doesn't. Keep an eye on those down (red) fractals.

Have an excellent start to the evening and the weekend,

TraderJoe

Wednesday, May 14, 2025

Trying to Resolve

On the daily ES chart, we showed a larger parallel which is still pending resolution. Below on the ES 4-Hr chart are two smaller parallels that are also pending resolution.

ES Futures - 4 Hr - Parallels Pending Resolution

We showed in the comments today - using the SPY 15-min proxy - how the smaller (dashed) channel can be making a fourth wave according to the Elliott Wave Oscillator. Tonight, the futures are traveling downward a bit more, but nothing is resolved yet. Bear in mind that neither of these parallels has to hold if this is a corrective wave. And the larger of these two channels may hold more risk. It's a time for caution and local counting.

Have an excellent rest of the evening,

TraderJoe

Monday, May 12, 2025

Local Technicals

Today's ES daily candle did the following: 1) it created a 'futures' gap up on the tariff non-news (or the 'manufactured' news), 2) ran up near the upper daily Bollinger Band, 3) closed near the high of the day, and 4) closed on breadth of only about 3.2 -to -1 which is pretty low for the number of points the market rose, and 5) maintained the close over the 18-day SMA with a bullish embedded slow stochastic.

ES Futures - Daily - Gap Up

Today popped slightly outside of the wedge, ran into the 100-day SMA and ran into the 200-day SMA all at the same time. So, there is likely some resistance in this area. Note, this is the second unfilled 'futures' gap up on the chart, which is a little rarer than for the cash gaps.

From a Fibonacci perspective the wave up since 18 Apr is now 100%+ the wave from the 7th to the 9th of last month, too.

And as regards EW there are several levels that could be placed such as (w), (x), (y) or (a), (b), (c) but they depend on whether or not a truncation is seen at the low or not. Suffice to say this could be a 'B' wave up or a '2' wave up with such an ugly count.

It will be interesting to see the put-call ratios when they come out later tonight. The CNN Fear & Greed model is back in the Greed category. Still, the bias and the trend are up until a reversal can be noted. Maybe that will come on a turn-around Tuesday - after a large up Monday. Maybe not.

I'm not getting into this whole tariff thing. It smells to me like it is nothing but announcements for what amounts to insider trading activities, and I don't want to give any energy at all to that kind of activity.

Have an excellent start to the evening,

TraderJoe


Thursday, May 8, 2025

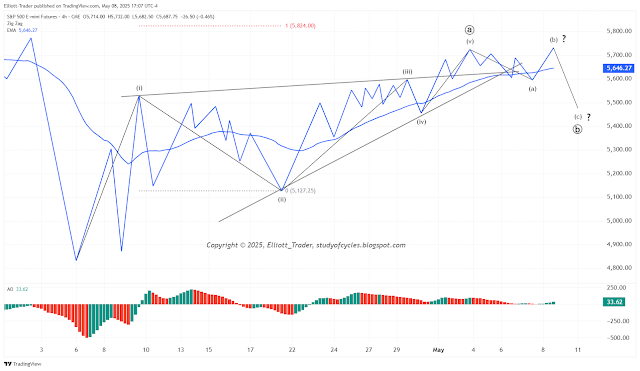
Smaller Wedge Still in Play - 2

While nothing is locked in stone in the ES 4-hr chart, the recent waves have been exceptionally difficult to decode.


The upward diagonal could be over because of the overlaps, and there could be a Flat wave in progress as shown.

Have a good start to the evening,

TraderJoe

Tuesday, May 6, 2025

Smaller Wedge Still in Play

With a follow-on to the weekend post, the smaller wedge in the ES 4-Hr chart is still in play. And there is clear downward overlap again. Price came down to support from two levels of trend lines.


Let's see if there is downside follow-through.

Have an excellent rest of the day.
TraderJoe

Saturday, May 3, 2025

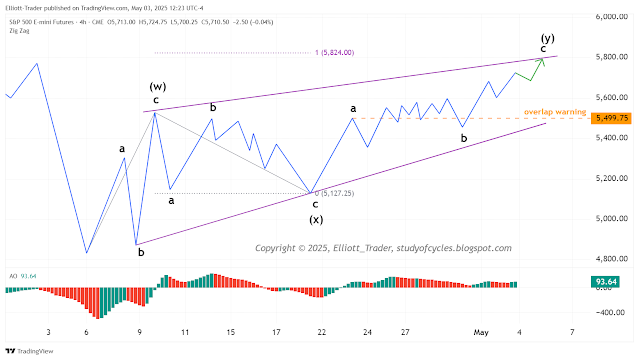
Wedge or Wedgier ?

Over the last several weeks we have been counting this pattern that starts out with a three-wave zigzag. The ES 4-hr chart (using the zigzag indicator to simulate a Neely-style chart) is below. The pattern in the wedge has 113 candles now - very close to the range of the desired 120 - 160 for The Eight-Fold-Path Method. And in the comments for the prior post, we said we could see the overlapping wedge pattern potentially finished as either a contracting diagonal or a triple zigzag. For the moment, there is no point in labeling the pattern until price significantly breaks the lower wedge line. One item to note is that in the potential diagonal count - as we noted in prior comments - nothing has invalidated as of this time.

ES Futures - 4 Hr - Wedge


I know you don't want any problems counting waves, but they do exist. One of the biggest ones is in knowing whether a movement is over or not. And we don't know upward movement is over. So, therefore we could also envision an alternate where this leg up extends until, say, Tuesday. If so, then the wedge might expand to make a wider wedge - more towards a channel - and a slightly different count could operate. That count is below.

ES Futures - 4 Hr - Larger Wedge or Channel

So, once again, we are in the position of counting very locally until we see if/when we can differentiate between the two counts, even though the first one is preferred at the moment - primarily so that the recent waves don't become too long in time.

A very significant down move on Monday night and follow-through lower might indicate the first pattern is the correct one.

Have an excellent rest of the weekend.

TraderJoe